Figure 5.

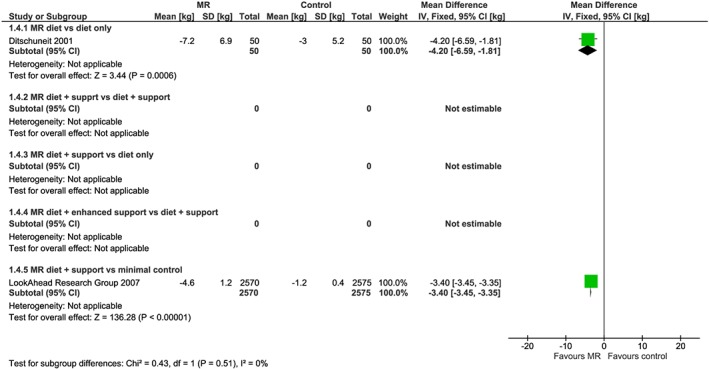
Forest plot of mean weight change (kg) from baseline at 4 years between interventions incorporating meal replacements (MR) and control interventions by comparison group [Colour figure can be viewed at http://wileyonlinelibrary.com]

Forest plot of mean weight change (kg) from baseline at 4 years between interventions incorporating meal replacements (MR) and control interventions by comparison group [Colour figure can be viewed at http://wileyonlinelibrary.com]