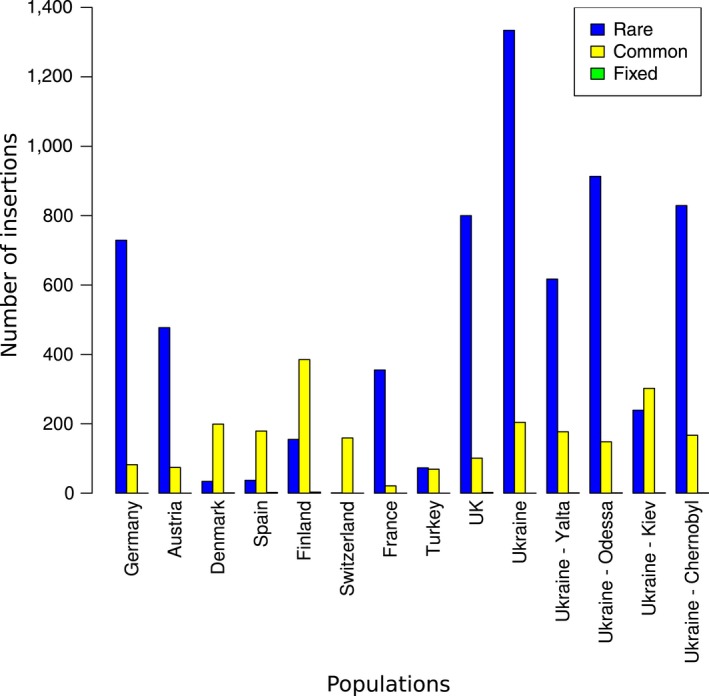
Figure 4.

Frequency distribution of de novo insertions identified by both popoolationte2 and tidal. For each population, the different insertions were categorized according to their population frequency in “rare,” “common” and “fixed” insertions [Colour figure can be viewed at http://wileyonlinelibrary.com]
