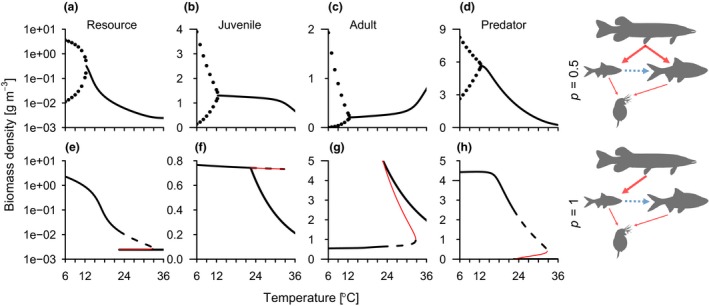
Figure 1.

Effects of warming on food chain stability depend on ecological interactions. Equilibrium biomass densities of the resource (a and e), consumer life stages (b, c, f and g) and predator (d and h) as a function of temperature, given a predator feeding with equal intensity on both life stages (a–d) (p = 0.5) or exclusively on juveniles (e–h) (p = 1). Black lines (full and dashed) are stable equilibria and red thin lines are unstable equilibria (connecting the two stable branches in the bistable region), which separate the two stable equilibria when there are alternative stable states. Maximum and minimum biomass density of a stable limit cycle is shown with points (top row below c. 12 °C). Alternative stable states, where predators are either extinct or abundant, occur between c. 22 and 33 °C (e–h). Note the different scales on the y‐axes and the logarithmic y‐axis for resources densities. , all other parameters have default values (Appendix S1, Table S2).
