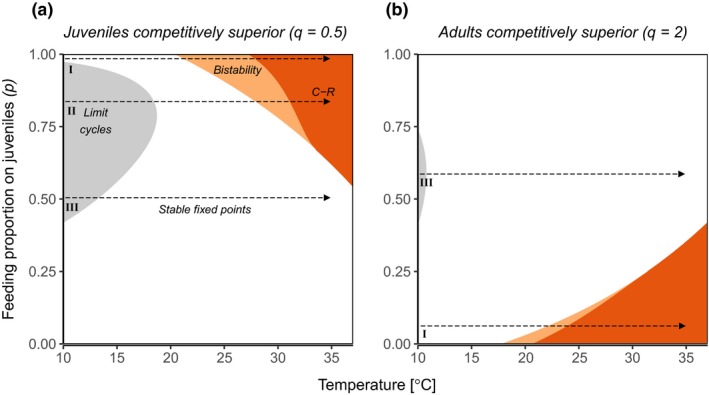
Figure 3.

Shifts in structure and stability with increasing temperature depend on the predators’ feeding preference (p), current temperature and which life stage is competitively inferior and therefore limits growth of the consumer population. Shown here are results for the generic model parameterisation with added temperature dependence (Appendix S1, Table S7 and S8). Panel (a) is analogous to the empirical model used for Figs 1 and 2 (juveniles competitively superior) and in (b) adults are superior competitors. In grey regions all species in the food‐chain exhibit stable population cycles, white corresponds to stable tri‐trophic states, orange shows bistable regions where the food chain exhibits alternative stable states with predators being either extinct or abundant (here the lower temperature boundary of the region corresponds to the invasion boundary and the upper is the persistence boundary), and dark orange is the stable consumer‐resource system where predators cannot persist. Roman numerals correspond to three distinct regions of predator feeding preference (p) that lead to different stability‐temperature relationships with warming (indicated by arrows along the temperature axis): I) warming destabilises the food chain by inducing bistability (alternative stable states), II) warming initially stabilises the food chain by switching the state from limit cycles to fixed point dynamics but eventually induces bistability III) warming stabilises the food chain by replacing cyclic dynamics with fixed points. , all other parameters have default values (Appendix S1, Table S7 and S8).
