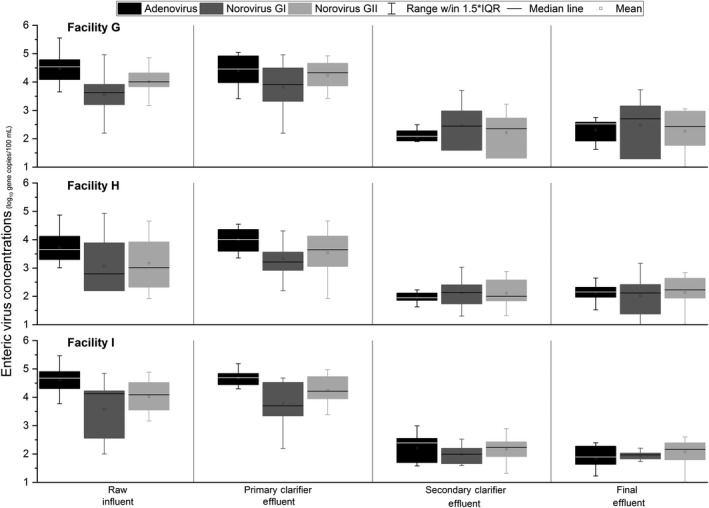
Figure 5.

Box‐and‐whisker plots of enteric virus concentration (gene copies) at each sampling location for Facilities G through I. Boxplot range is the 25th–75th percentile. Whisker range is 1.5 × the interquartile range (IQR). Means are depicted with squares.
