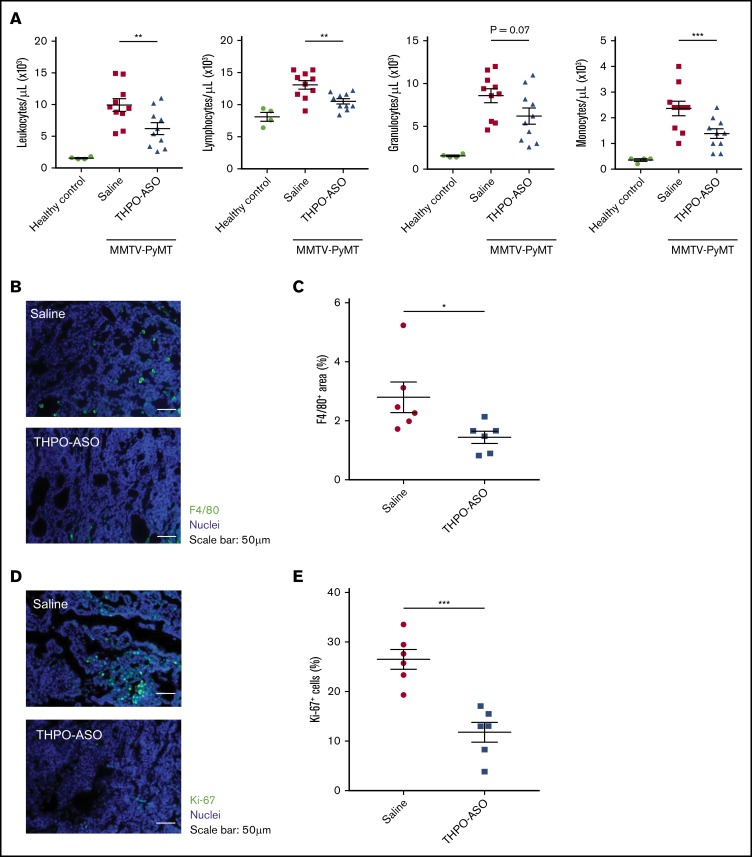
Figure 5.
Peripheral leukocyte profile, and intratumoral macrophages and cell proliferation index. (A) Leukocyte profile from complete blood counts at 80 days of age in healthy and MMTV-PyMT mice. (B) Representative images of tumor-infiltrating macrophages on histopathology at the time of euthanasia (complete palpable tumor volume of 2 cm3). Macrophages were visualized with an antibody directed against F4/80, the murine homolog of epidermal growth factor–like module-containing mucin-like hormone receptor-like 1 (green). Nuclei were visualized with Hoechst 33342 (blue). Scale bars, 50 µm. (C) Percentage of F4/80-positive area in the field of view in tumors from untreated (n = 6) and THPO-ASO–treated (n = 6) mice. A 2-tailed, unpaired Student t test was used for comparison of means. *P < .05; **P < .01; ***P < .001. (D) Representative images of proliferating cells in tumors. Proliferating cells were identified by Ki-67, an antibody directed against the MKI67 proliferation-related antigen (green). Nuclei were visualized with Hoechst 33342 (blue). Scale bars, 50 µm. (E) Number of Ki-67–positive (S-phase) cells in magnification field in samples from untreated (n = 6) and THPO-ASO–treated (n = 6) mice. Fifteen fields of view per tumor were analyzed for quantification. Every breast tumor was evaluated for each mouse. A 2-tailed, unpaired Student t test was used for comparison of means. *P < .05.

