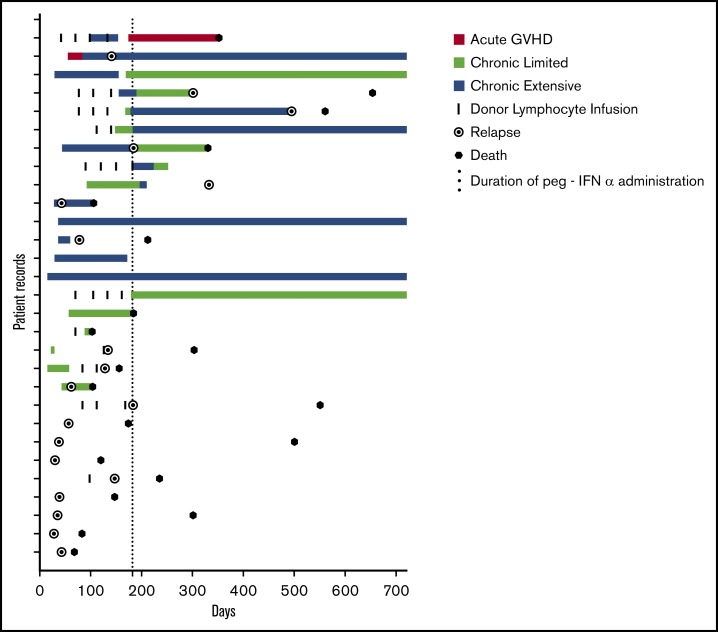
Figure 2.
GVHD. Swimmer plot demonstrating the development of GVHD during the trial. Onset, duration, and classification of GVHD are depicted in addition to episodes of DLI for each patient on trial. The 6-month period of treatment with peg-IFN is indicated by the dotted line. Relapse and death are indicated if they occurred during the 2-year period depicted.

