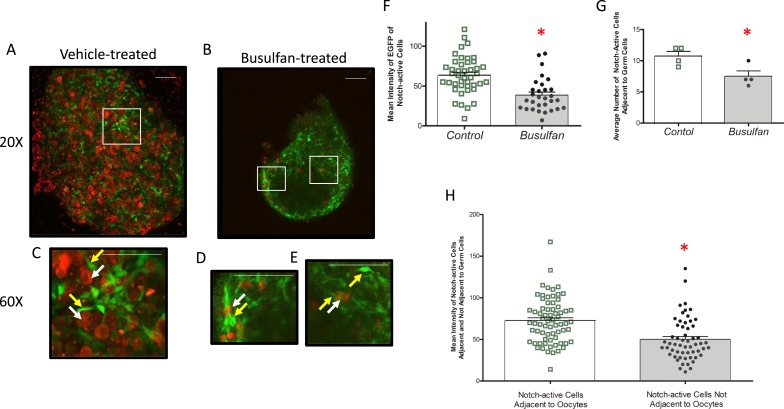
Figure 3.
Relationship between Notch activity and remaining germ cells in the busulfan-exposed embryonic ovary. Embryonic ovaries isolated at E18.5 from dams injected with (A) vehicle or (B) busulfan at E11.5 are shown. Whole ovaries were used for confocal fluorescence microscopy to detect the Sohlh1-mCherry reporter (germ cells) or the TNR-EGFP reporter (Notch-active cells). The white boxes indicate specific areas shown at increased magnification in (C)–(E). The white arrows indicate oocytes, and the yellow areas show GFP-positive somatic cells. These are generally in close association (C and D), although examples of GFP-positive cells without an apparent oocyte in the visual field are observed [single yellow arrow in (E)]. (F) Mean fluorescence intensity of EGFP-expressing somatic cells in control and busulfan-treated ovaries is shown, determined as described in the “Methods” section. (G) The average number of these EGFP-positive cells in proximity to oocytes as a function of the treatment is shown. (H) Mean fluorescence intensity of EGFP-positive cells either adjacent to or away from oocytes, determined as described in the “Methods” section. n = 4 mice for each group. (A–E) Scale bars, 50 μm. The bars over the scatter plots designate mean ± SEM. *P < 0.05.

