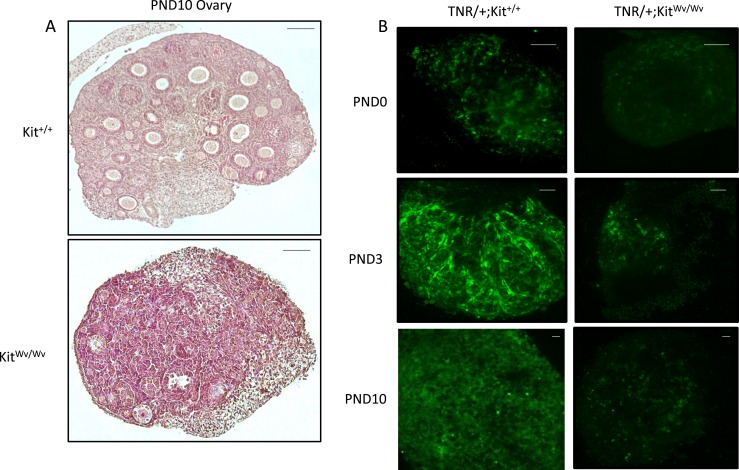
Figure 4.
TNR (EGFP) expression in the tnr/white-spotted mouse ovary. (A) Ovarian histology of representative control (Kit+/+) and mutant (KitWv/Wv) animals at PND10. Scale bars, 100 µm. (B) EGFP imaging at PND0, PND3, and PND10 in control and white-spotted ovaries. Original magnification, ×20; scale bars, 100 µm. These are representative of n = 3 for each group at each time point shown.

