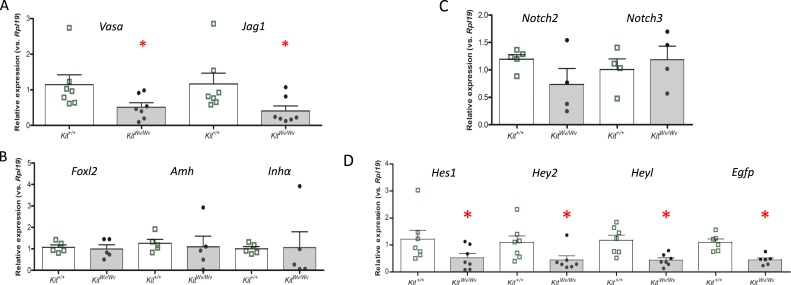
Figure 6.
Ovarian gene expression in control and white-spotted mouse ovaries at PND19. Ovaries were isolated at PND19 from TNR/Kit+/+ mice (open bars with green boxes) or TNR/KitWv/Wv mice (filled bars with black circles) and RNA was prepared for qRT-PCR analyses of mRNA abundance. (A) Germ cell markers. (B) Granulosa cell markers. (C) Notch receptors. (D) Notch target/effector and reporter genes. n = 4 to 7, with the number of animals for each measurement indicated by the individual symbols shown in the scatter plots. The bars designate the mean ± SEM. *P < 0.05.

