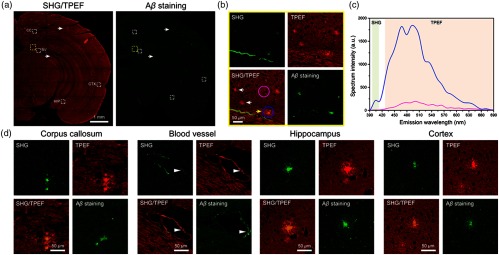
Fig. 2.
Imaging of extracellular plaques in APP/PS1 mouse model. (a) Representative large-scale SHG/TPEF images and a corresponding immunofluorescence image of a half hippocampal coronal plane. CC, corpus callosum; BV, blood vessel; HIP, hippocampus; CTX, cortex. (b) Enlarged images from yellow dashed box in (a). Yellow arrows, plaque with strong TPEF signal and weak SHG signal. White arrows, plaque with no SHG signal. (c) Emission spectrum from plaque region (blue line) and adjacent region with no plaque (pink line). (d) Enlarged SHG/TPEF images from white dashed box in (a). Arrowhead, plaque detected near the pial vessel. SHG, color-coded green. TPEF, color-coded red.

