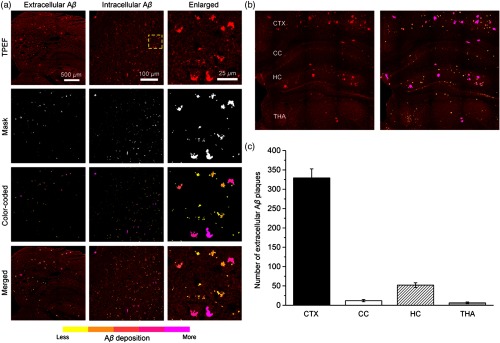
Fig. 7.
Rapid visualization of deposition. (a) Representative extracellular and intracellular depositions. Enlarged images were zoomed in from yellow dashed box. From yellow to magenta, different colors represent the different degrees of deposition. (b) A part of representative hippocampal plane from 10-month-old APP/PS1 mouse. (c) Comparison of the number of extracellular plaques in CTX, HC, CC, and THA regions.

