
Figure 5.
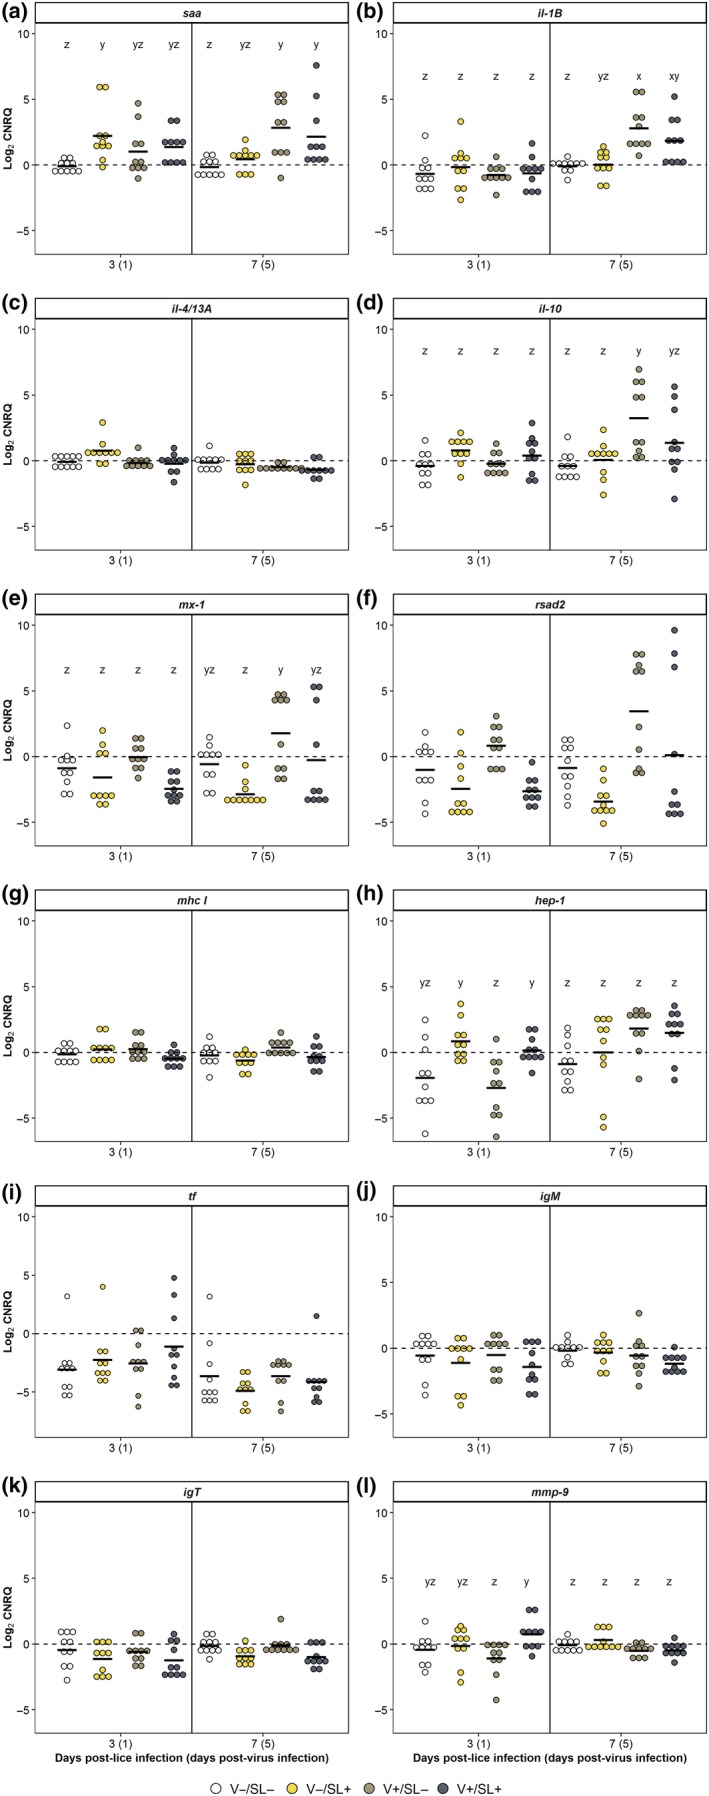
Gene expression for sockeye salmon kidney sampled at 3 and 7 days post‐lice infection (1 and 5 days post‐virus infection). Each dot represents an individual fish. The black bar denotes the mean expression value for that group. Letters denote statistically significant differences in values between groups within a sampling time if there was a significant interaction of treatment and dpl for that parameter (p ≤ 0.05) [Colour figure can be viewed at http://wileyonlinelibrary.com]