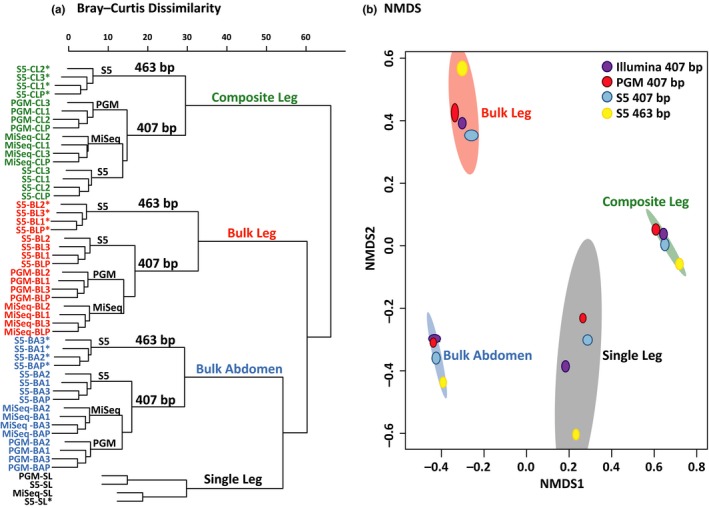
Figure 4.

(a) Bray–Curtis dissimilarity dendrogram for the four amplicon pools (BA = Bulk Abdomen, BL = Bulk Leg, CL = Composite Leg and SL = Single Leg). Replicates are numbered 1–3 while P is the result from pooling the replicates. The 463 bp amplicon is indicated with an asterisk (*). (b) Nonmetric multidimensional scaling (NMDS) ordinations using Bray–Curtis dissimilarity for the four amplicon pools. Coloured ellipses represent 95% confidence intervals for the BIN composition of the different treatments using ordiellipse (Oksanen et al. 2012). The shapes within each ellipse represent replicates for the four combinations of sequencing platform–amplicon length for three treatments. No replicates were available for the Single Leg treatment, so it has just four points [Colour figure can be viewed at http://wileyonlinelibrary.com]
