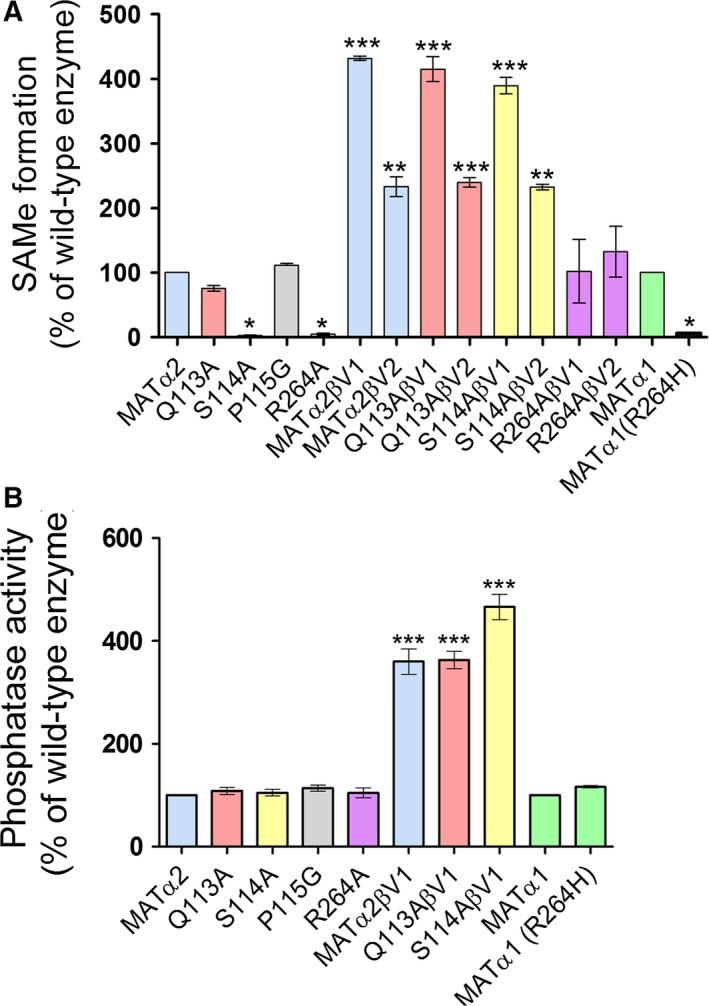
Figure 1.

Enzymatic and phosphatase activities of wild‐type and mutant enzymes. (A) SAMe formation of wt MATα1 and wt MATα2 compared to mutant enzymes (B) Phosphatase activity of wild‐type enzymes and complexes compared to mutant enzymes. (‘*’, ‘**’, and ‘***’ denote statistical significance at P < 0.05, P < 0.01, and P < 0.001 compared with wt MATα1/2, respectively). Data are mean ± SEM (n = 3).
