Figure 2.

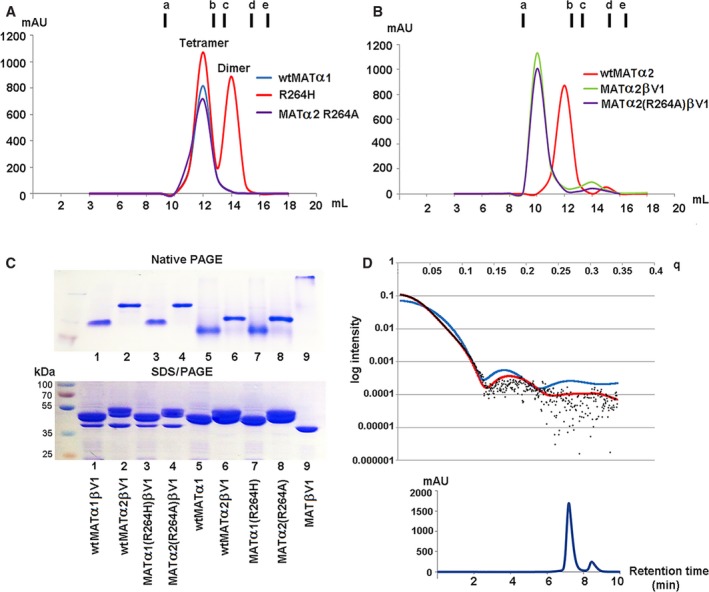
Oligomeric states of MATα2 R264A mutant and MATα1 R264H mutants. Arg264 mutation of MATα1 and MATα2 Gel filtration profiles of (A) wt MATα1 R264H and MATα2 R264A mutant; (B) wt MATα2–MATβ and MATα2 (R264A)–MATβ complexes compared to wt MATα2 alone. Vertical markers (A,B) represent the elution volumes of molecular standard proteins (GE healthcare) including ferritin (a, 440 kDa), aldolase (b, 158 kDa), conalbumin (c. 75 kDa), ovalbumin (d, 43 kDa), and ribonuclease (e, 13.7 kDa) at 9.25, 12.51, 13.32, 14.90, and 16.34 mL, respectively. (C) Native (upper panel) and SDS/PAGE (lower panel) gels of the complexes (MATα1‐MATβV1, MATα2‐MATβV1, MATα1(R264H)‐MATβV1, MATα2(R264A)‐MATβV1) and each individual protein (MATα1, MATα2, MATα1(R264H), MATα2(R264A), MATβV1). For complex formation MATα1 and MATα2 was incubated with both MATβV1 prior to being loaded onto a Superdex 200 10/300. (D) Crystal structure data were used to calculate SAXS profile (red, blue line) and fitted to SAXS experimental data of MATα2 R264A (black dot). X‐ray scattering profile (black dot) is compared with the tetrameric crystal structure (red line, PDB ID: http://www.rcsb.org/pdb/search/structidSearch.do?structureId=5UGH (model); χ = 1.65, C1 = 1.01, C2 = 3.65, Rg = 36.55) and dimeric crystal structure (blue line, PDB ID: http://www.rcsb.org/pdb/search/structidSearch.do?structureId=1QM4 (model); χ = 27.38, C1 = 1.05, C2 = 4.00, Rg = 24.73). The experimental data are a better fit in the tetrameric state with the value of Chi (χ) = 1.65, compared to χ = 27.38 of the dimer for the original crystallographic structure (upper panel). Retention time of MATα2 R264A elution peak is 7.244 min (lower panel).
