Figure 6.

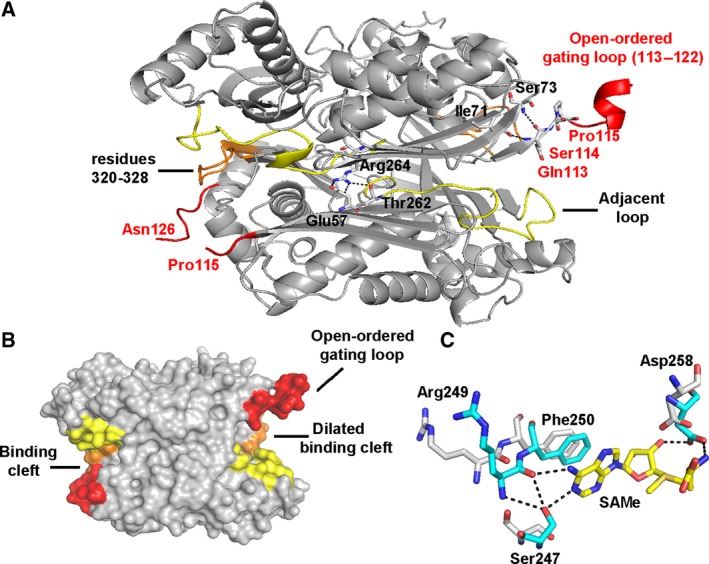
Conformational changes between apo‐ and ligand‐bound wt MATα2. (A) Apo‐wt MATα2 dimer (gray) shows an ordered and visible gating loop (red) and substrate/product‐binding pocket (yellow and orange). The interactions of the key residues Gln113, Ser114, and Pro115 and R264A are shown in the local surrounding. (B) The surface view of the substrate‐binding clefts of apo‐wt MATα2 (gray) is shown with a gating loop (red), adjacent loop (245–264, yellow), and residues 320–328 (orange) (C) Structural comparison between holo‐ (blue stick) and apo‐ (white stick) wt MATα2 shows SAMe interactions with Ser247, Arg249, and Asp258 and their positions in the apo‐state.
