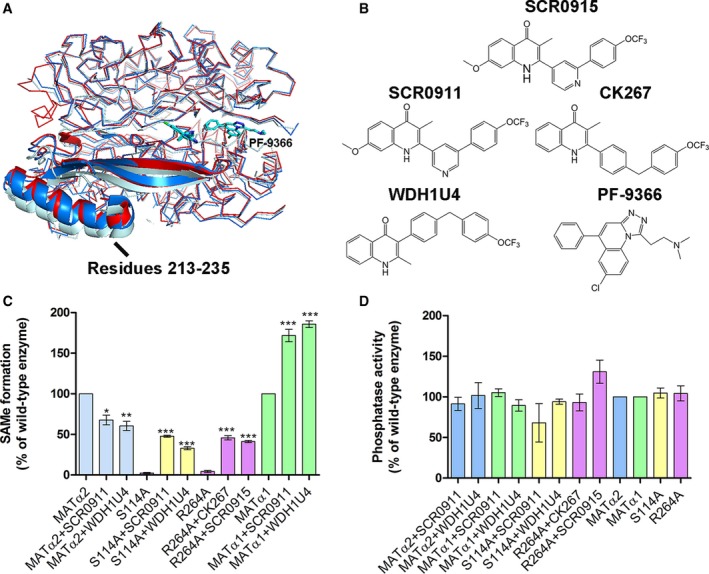
Figure 8.

Structural comparison of PF9366‐bound structure to holo‐wt MATα2 and MATαβ complex structure and quinolone‐based compound study. (A) PF9366‐bound structure (PDB: http://www.rcsb.org/pdb/search/structidSearch.do?structureId=5UGH, bright blue), holo‐wt MATα2 (PDB: http://www.rcsb.org/pdb/search/structidSearch.do?structureId=5A1I, red), and MATαβ complex structure (PDB: http://www.rcsb.org/pdb/search/structidSearch.do?structureId=4NDN, pale blue) are shown. Domain (181–269) with the biggest shift in helical loop (residues 213–235) is shown as cartoon. PF‐9366 is shown as a blue stick. (B) Quinolone‐based compounds used in this study and PF9366 MATα2 inhibitor are shown. (C) Effect of quinolone‐based compounds (10 μm) on SAMe formation of wt MAT and mutants. SAMe formation was analyzed by S‐adenosylmethionine ELISA kit (Cell biolabs). All enzymes were preincubated with methionine before adding ATP to initiate the reactions. (D) Phosphatase activity was unaffected by any of the chemical compounds. Data are mean ± SEM (n = 3). All reactions of enzyme assays were measured at 750 nm.
