Figure 10.

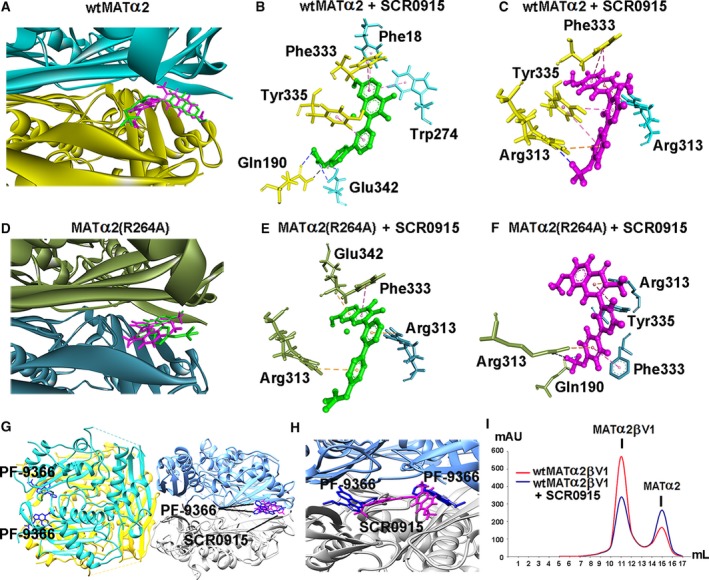
Molecular modeling of ligand‐binding site using Autodock Vina and SwissDock. (A) MATα2 dimeric interface is shown in blue and yellow ribbon. The best pose of SCR0915 binding site is predicted by Autodock Vina and SwissDock. SCR0915 is shown in green stick (Autodock Vina) and magenta stick (SwissDock) (B, C) SCR0915 and wtMATα2 interaction profiles obtained by Autodock Vina and SwissDock are demonstrated, respectively. (D) MATα2 (R264A) dimeric interface is shown in blue and green ribbon. The best pose of SCR0915 binding site is obtained by Autodock Vina and SwissDock. (E, F) SCR0915 and MATα2 (R264A) interaction profiles obtained from Autodock Vina and SwissDock are visualized, respectively. Protein–ligand interactions are shown in dashed line with black (H‐bond), bule (halogen bond), pink (hydrophobic interaction: π–π stacking), and orange color (electrostatic interaction) (G) PF‐9366‐MATα2 structure (PDB, http://www.rcsb.org/pdb/search/structidSearch.do?structureId=5UGH) is shown in tetramer with two molecules of PF‐9366 (blue stick) in each dimer. The modeling of SCR0915‐binding site obtained by SwissDock (magenta stick) overlaps the PF‐9366‐binding site. (H) Close‐up view of the PF‐9366 and SCR0915‐binding site in wt MATα2 (PDB, http://www.rcsb.org/pdb/search/structidSearch.do?structureId=5UGH). (I) Gel filtration profile of wt MATα2‐MATβV1 complexes is shown. MATα2 is preincubated with 10 μm SCR0915 before forming a complex with MATβV1 (red line). MATα2β complex without SCR0915 intervention is shown (blue line).
