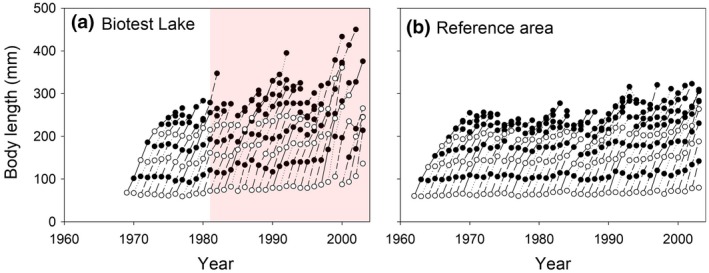
Figure 3.

Warming effects on fish growth trajectories. Growth trajectories of different cohorts (each point representing mean length‐at‐age from back‐calculated individual growth trajectories and each line one cohort) of perch in (a) the artificially heated enclosed coastal ecosystem, the Biotest Lake (1969–2004), and (b) its adjacent reference area (1962–2004). The first point in each (cohort) line represent 1 year old individuals, the second 2 year olds, etc. 1, 3 and 5 year old individuals are highlighted in white. The light red area indicates the period during which the Biotest Lake received warm water
