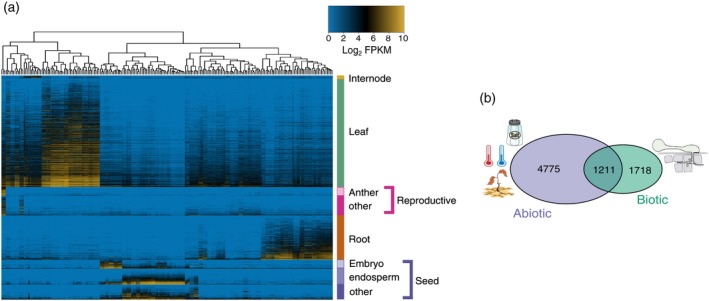
Figure 2.

Organ‐specific and stress‐induced differential gene expression.
(a) Heatmap of log2 fragments per kilobase of transcript per million mapped reads for the 4154 genes identified as organ‐specific in one of the six organs. Hierarchical clustering was performed on the samples and the dendrogram is on top of the heatmap. Organ and tissue‐specific genes are denoted on the right‐hand side and are grouped by organ. (b) Venn diagram of genes differentially expressed under abiotic stress (salt stress, drought (Opitz et al., 2014), and temperature stress (Makarevitch et al., 2015)), biotic stress [Colletotrichum graminicola and Cercospora zeina infection (Swart et al., 2017)], and both stress types.
