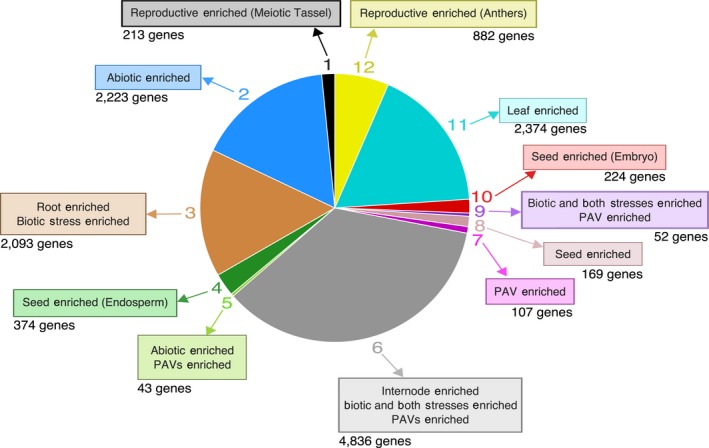
Figure 3.

Weighted gene co‐expression network analysis modules.
Pie chart of the 12 co‐expression modules identified through weighted gene co‐expression network analysis. Numbers around the outside of the pie chart indicate the module and numbers beneath the boxes indicate the number of genes present in each module. Boxes around the pie chart indicate organ‐specific, stress‐related, and presence−absence variant (Brohammer et al., 2018) enrichment within the module. Tissues in parentheses after an organ indicate enrichment of those tissue‐specific genes. ‘Both stresses’ refers to genes that are differentially expressed under both abiotic and biotic stress types.
