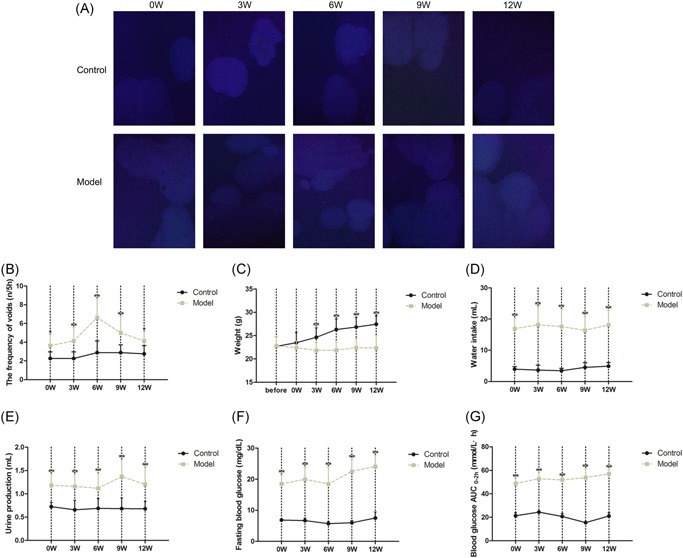
Figure 1.

General characteristics of diabetes mellitus (DM) model and age‐matched control mice from 0 to 12 weeks after the induction (n = 15). A, The image from 5 hours voided stain test, (B) 5 hours frequency of urination, (C) weight, (D) water intake, (E) 5 hours Urine production, (F) Fasting blood glucose (FBG), (G) Blood glucose (BG) AUC0−2h (n = 15, according to the following formula: BG AUC(0–2h) = [(BG0 + BG15) × 0.5] ÷ 4 + [(BG15 + BG30) × 0.5] ÷ 4 + [(BG30 + BG60) × 0.5] ÷ 2 + [(BG60 + BG120) × 0.5]). Data represent the means ± SD (model vs control group, **P < 0.01 or *P < 0.05). SD, standard deviation
