
Figure 2.
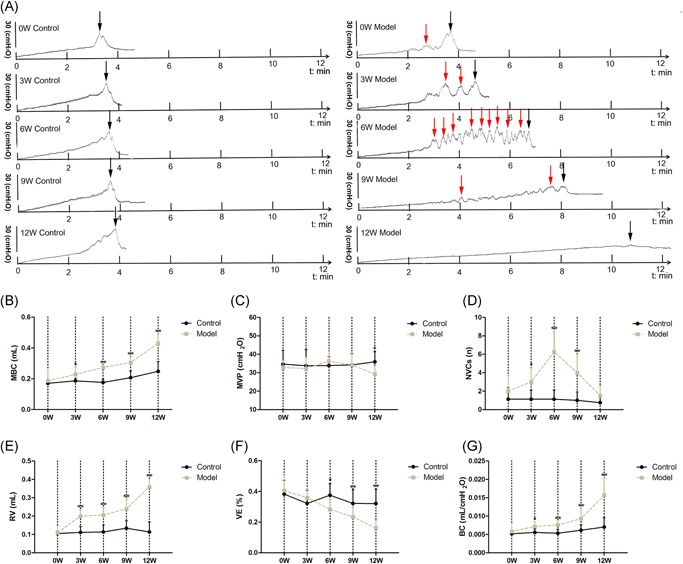
A, Representative cystometric recording from the age‐matched control and DM mice from 0 to 12 weeks after the induction (n = 8). B, Maximum bladder capacity (MBC), (C) maximum voiding pressure (MVP), (D) the frequency of nonvoiding contractions (NVCs), (E) residual volume (RV), (F) voiding efficiency (VE, calculated as [(MBC − RV)/MBC] × 100%), (G) bladder compliance (BC; calculated as [(MBC/MVP) × 100%]). Data represent the means ± SD (model vs. control group, *P < 0.05 or **P < 0.01). Black arrows indicate the micturition peaks and red arrows represent the nonvoiding contractions (NVCs). DM, diabetes mellitus; SD, standard deviation