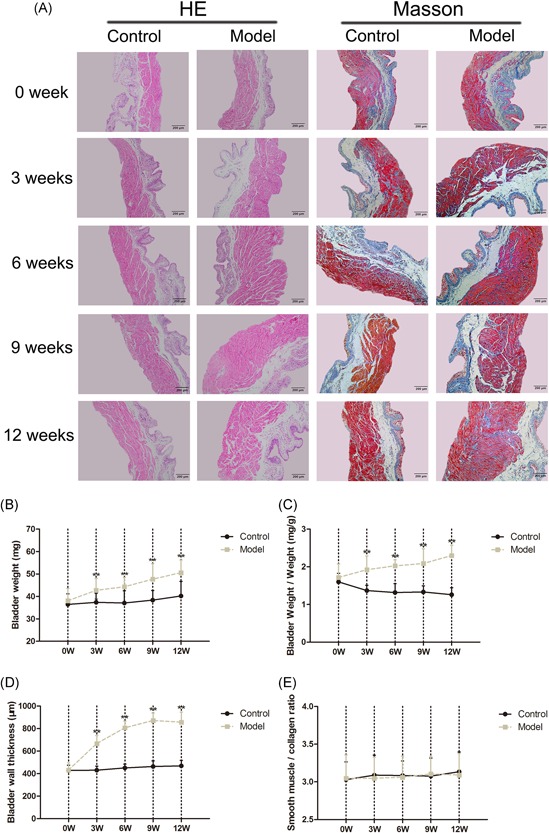
Figure 3.

Absolute and relative bladder weights of the age‐matched control and DM mice from 0 to 12 weeks after induction (n = 15). A, Bladder weight, (B) bladder‐weight‐to‐body‐weight ratio; H&E and Masson's trichrome staining digital images (100×) of the age‐matched control and DM mice from 0 to 12 weeks after the induction (n = 7). C, Bladder wall thickness (BWT) determined by H&E images, (D) smooth muscle‐to‐collagen ratio calculated from the Masson's trichrome images. All images were processed and analyzed with special software (Image Pro 6.0) (model vs control group, *P < 0.05 or **P < 0.01). DM, diabetes mellitus; H&E, hematoxylin and eosin
