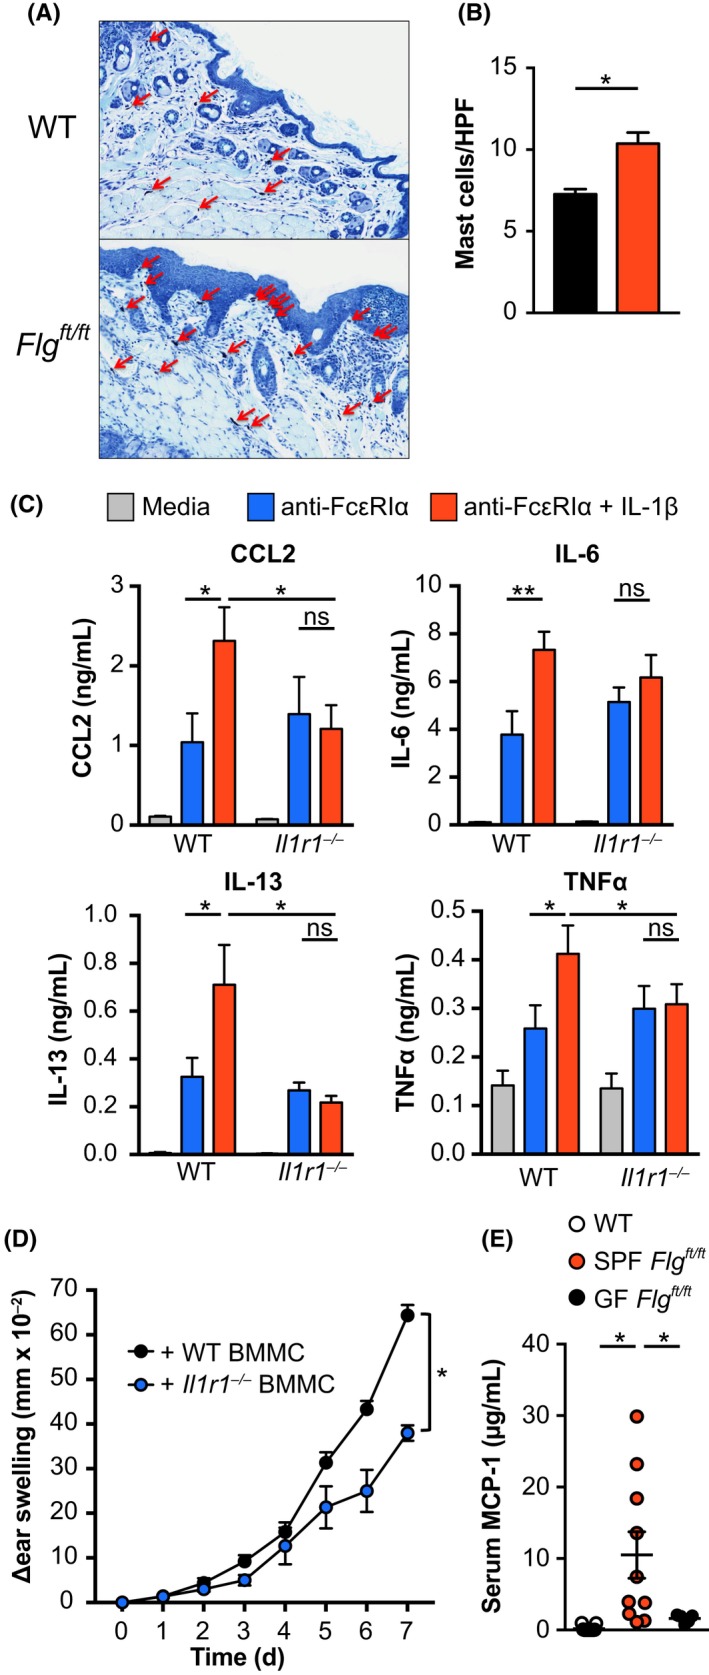
Figure 6.

IL‐1β drives hyperactivation of mast cells in AD‐like inflammation. A, Toluidine blue staining of wild‐type (upper panel) and Flgft/ft (lower panel) skin. Red arrows indicate connective tissue mast cells. B, Quantification of mast cells per HPF from toluidine blue stained skin samples. Bar graphs show the mean + SEM from 8 mice per group. *P < 0.05, ttest. D, Bone marrow–derived mast cells from wild‐type (left) and Il1r1−/− (right) mice were stimulated with media (light gray) or plate‐bound anti‐FcεRIα (10 µg/mL) in the presence (red) or absence (blue) of recombinant IL‐1β (10 ng/mL). CCL2, IL‐6, IL‐13, and TNFα were measured by ELISA. Bars show the mean + SEM of nine replicates from three independent experiments. *P < 0.05. E, Wild‐type (black) and IL‐R1−/− (blue) mast cells were transferred intradermally into the ears of KitW‐shFlgft/ft mice. Six weeks later, MC903 or 100 EtOH was applied onto the ears and ear thickness was measured daily. Graph shows the mean + SEM of 5 mice per group from two experiments. *P < 0.05, t test of AUC. F, Serum mast cell protease 1 levels from adult (10 wk) wild‐type (open circles), Flgft/ft (red), and germ‐free Flgft/ft (black) mice. *P < 0.05
