
Figure 3.
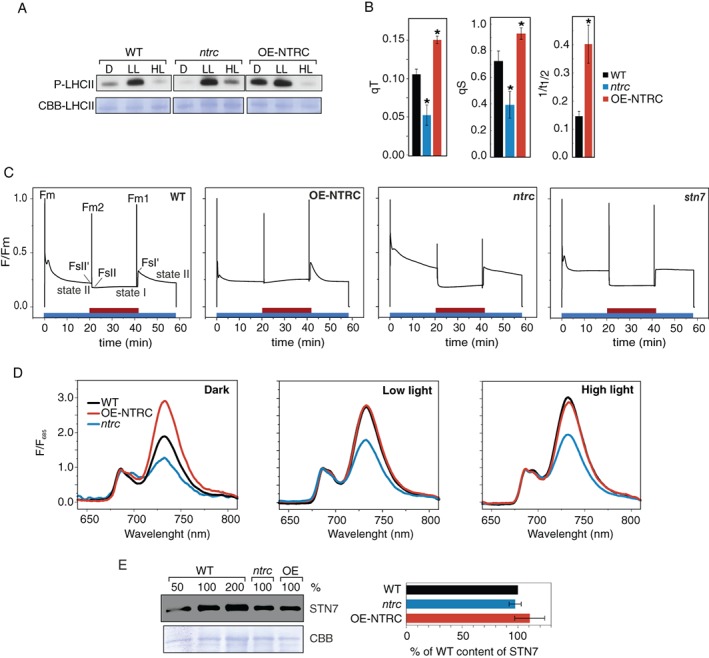
LHCII protein phosphorylation and state transitions in WT, ntrc and OE‐NTRC. (A) Determination of phosphorylation status of LHCII proteins in WT, ntrc, and OE‐NTRC. Thylakoid membranes were isolated after incubation for 2 h in darkness (D), low light (LL, 40 μmol photons m−2 s−1), and high light (HL, 600 μmol photons m−2 s−1). Thylakoid extracts with 0.4 μg of Chl were separated with SDS‐PAGE and phosphorylated proteins were detected with a Phosphothreonine‐specific antibody. Coomassie brilliant blue staining of LHCII on the membrane (CBB‐LHCII) was used as loading control. (B) The state transition parameters qT, qS and 1/t 1/2 in WT, ntrc and OE‐NTRC. Parameters were calculated from Chl a fluorescence changes shown in (C) as follows: qT = (Fm1−Fm2)/Fm2) (Bennett 1979, Jensen et al. 2000), qS = (FsI′‐FsII′)/(FsI′−FsII) (Ruban and Johnson 2009), 1/t 1/2 = inverse of the half time of fluorescence decay from FsI' to FsII level. The values are averages of measurements from five to six individual leaves ± SE. * indicates statistically significant difference to WT according to Student's t‐tests (P < 0.05). The 1/t 1/2 parameter could not be quantified from ntrc, because fluorescence decay was too slow to reliably determine a half time. (C) Representative curves of Chl a fluorescence traces from WT, OE‐NTRC, ntrc and stn7. Red bar = far red light. (D) Chl a fluorescence emission spectra at 77 K from thylakoid membranes isolated after incubation for 2 h in darkness, LL, and HL. Excitation wavelength was 440 nm, and the spectra were normalized to the level of fluorescence at 685 nm. Averaged curves from three measurements are shown. (E) Protein content of STN7 in thylakoid extracts from WT, ntrc and OE‐NTRC. A representative immunoblot loaded on basis of protein content and quantified averages from five experiments ± SE are shown. Coomassie brilliant blue (CBB) staining was used as loading control.