Figure 5.

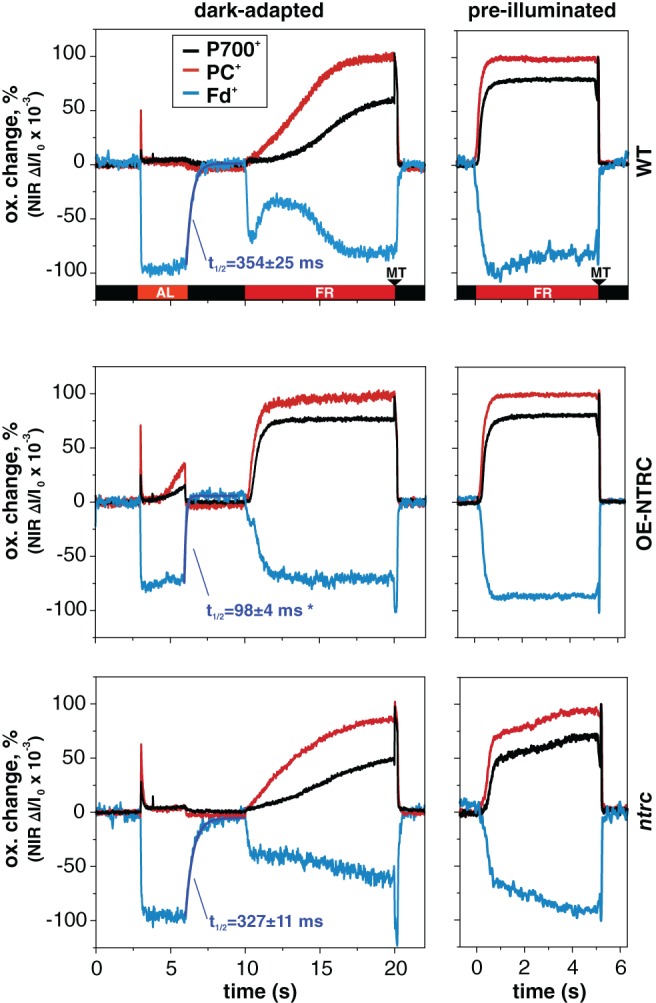
Oxidation and reduction kinetics of P700 (black), PC (red) and Fd (cyan) upon FR illumination in dark‐adapted leaves and leaves pre‐illuminated with 22 μmol photons m−2 s−1 for 10 min. Prior to FR‐illumination, the dark‐adapted leaves were first illuminated with 200 μmol photons m−2 s−1 of actinic light (AL) for 3 s to induce maximal reduction of Fd. A multiple‐turnover flash (MT) was administered after FR to induce maximal oxidation of P700 and PC. Representative curves normalized to maximal oxidation of P700 and PC and maximal reduction of Fd from measurements from six to 12 individual leaves are presented. Blue curves are first‐order exponential fits to post‐AL re‐oxidation kinetics of Fd, and average half times of Fd re‐oxidation (t 1/2 ± SE) calculated from measurements from six to 12 individual leaves are shown. Statistically significant difference to WT according to Student's t‐test (P < 0.05) is indicated by *.
