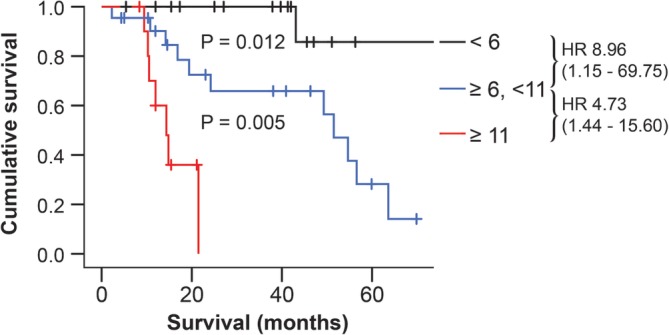
Figure 4.

Survival stratified according to the Utrecht score using Kaplan‐Meier analysis. Survival times were calculated from the time of surgery to euthanasia because of recurrence. Censored dogs are indicated as tick marks. Dogs were classified as having a Utrecht score of <6 (black line, n = 17), of ≥6 to <11 (blue line, n = 22), or of ≥11 (red line, n = 11). HR indicates estimated hazard ratios (with 95% confidence interval designated in parentheses). P values indicate the significance of the difference between the groups as calculated with the log‐rank test
