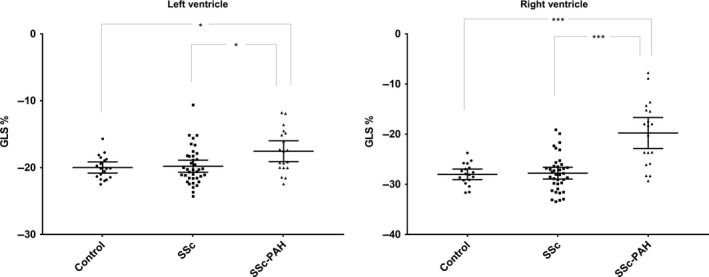
Figure 3.

Peak global longitudinal strain (GLS) in controls, systemic sclerosis (SSc) and systemic sclerosis with pulmonary arterial hypertension (SSc‐PAH) in mean ± CI (95%). Left panel shows peak left ventricular (LV) GLS. Right panel shows GLS in the right ventricular (RV) free wall. Control group (dots) (LV: n = 19, RV: n = 18), patients with SSc (squares) (n = 38) and patients with SSc‐PAH (triangles) (n = 19). *P<0·05, ***P<0·001
