
Figure 3.
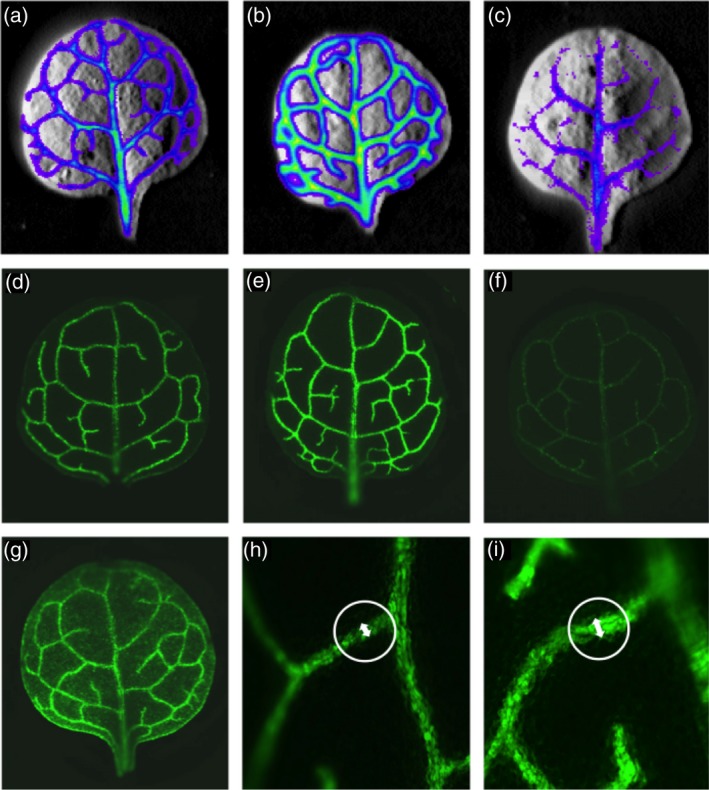
Results of the EMS primary screen.
(a) Luminescence signal emitted by the reference line compared with (b) a mutant line with increased and (c) decreased reporter gene signal relative to control/reference line. (d) GFP fluorescence of the reference line compared with (e–g) three different classes of primary mutants with either (e) more, (f) less, or (g) a diffused reporter gene activity in the leaves. (h, i) A close‐up view of 3° veins of (h) the reference line and (i) mutant line G‐19. The width of the veins is emphasized by white arrows.