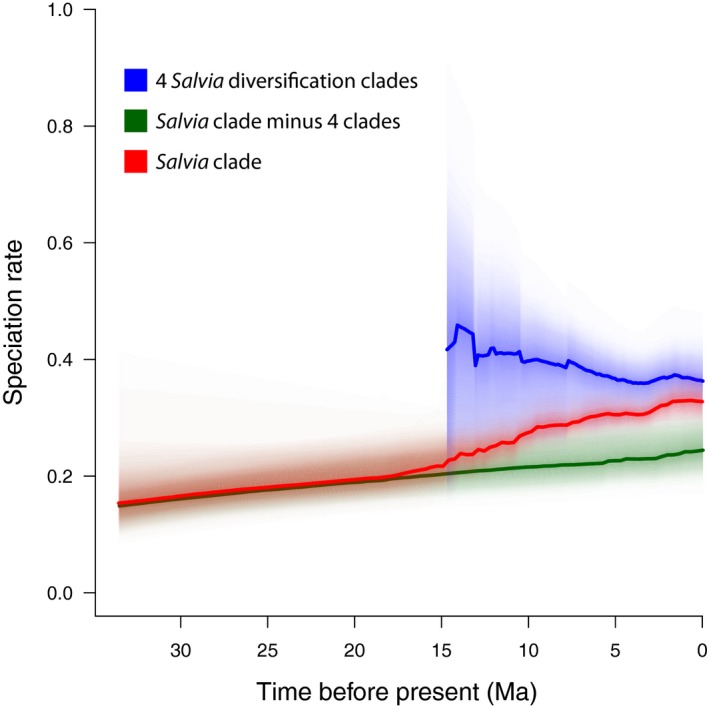
Figure 5.

Overall rate of speciation in Salvia (red graph) slowly increasing from 32 to 15 Ma, but accelerating 3‐fold beginning with the first large shift in subgen. Calosphace around 15 Ma. Speciation rate of just the four clades exhibiting significant BAMM shifts on their edges (see Fig. 4) is shown as the blue graph. The background rate of speciation in Salvia minus these four clades is shown as the green graph.
