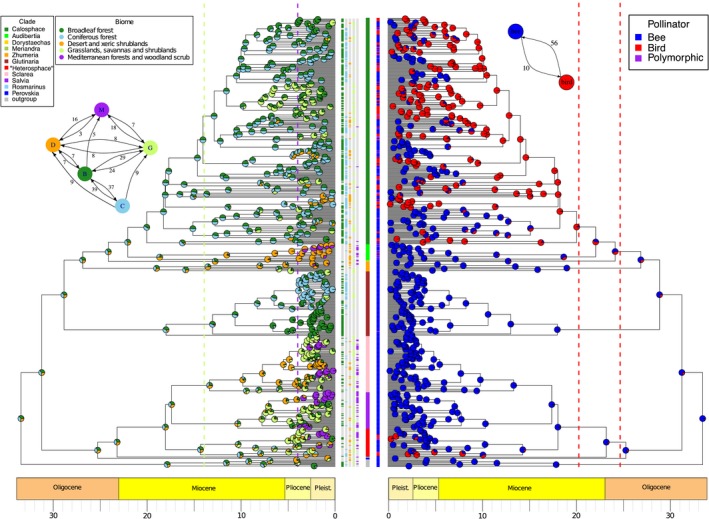
Figure 8.

Reconstruction of (A) biome and (B) pollinator shifts in Salvia using mirror BEAST MCC trees (see Fig. 4). Terminals are color coded by subgenus in the center column. (The informal “Heterosphace” is used here and includes New World “Salviastrum” and Old World “Verticillata” and their relatives; the “Salvia aegyptiaca clade” is informally placed here with previously recognized subgen. Zhumeria). Species names for each terminal are provided in Appendix S8. (A) Biome shifts were obtained with a modified BAYAREALIKE model in BioGeoBEARS. Frequency of biomes reconstructed at each node are summarized across the MCC and 10 grove trees. Terminals are scored for each of the five biomes by color coding in the five columns to their right. Dashed lines represent the time constraints placed on the origin of grassland (14 Ma) and Mediterranean (4 Ma) biomes. Inset A depicts the number of transitions between biomes. (B) Pollinator shifts were obtained using the function rayDISC of the R package corHMM, estimated transition rates were used to set the weights at the root, and the MCC and grove trees were sampled. Terminals are scored for bee, bird, or polymorphic by color coding in the column to their left. Dashed lines indicate the 95% confidence interval of the crown radiation of hummingbirds (McGuire et al., 2014). Inset B depicts the number of pollinator transitions between bird and bee pollination systems.
