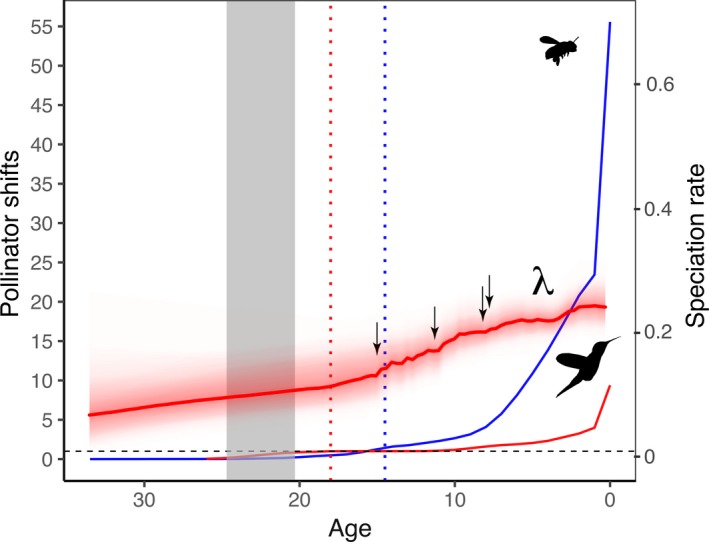
Figure 9.

Cumulative number of shifts to bird (red graph) or bee (blue graph) pollination through time in Salvia averaged across 100 PP trees (left axis). Ancestral state for the subtribe Salviinae is bee pollination. Dashed gray horizontal line indicates the threshold when on average one transition to either bee or bird pollination occurs across the 100 PP trees. The red and blue vertical dashed lines indicate when the first transition to either bird or bee pollination, respectively, occurs on average across the 100 PP tree. Overall speciation (λ) rate (right axis) for Salvia from BAMM analysis (thick red graph; see Fig. 5) and ages of the four BAMM shifts (arrows; see Fig. 4) in diversification are provided for context. The vertical gray rectangle depicts the 95% confidence interval of the crown radiation of hummingbirds (McGuire et al., 2014).
