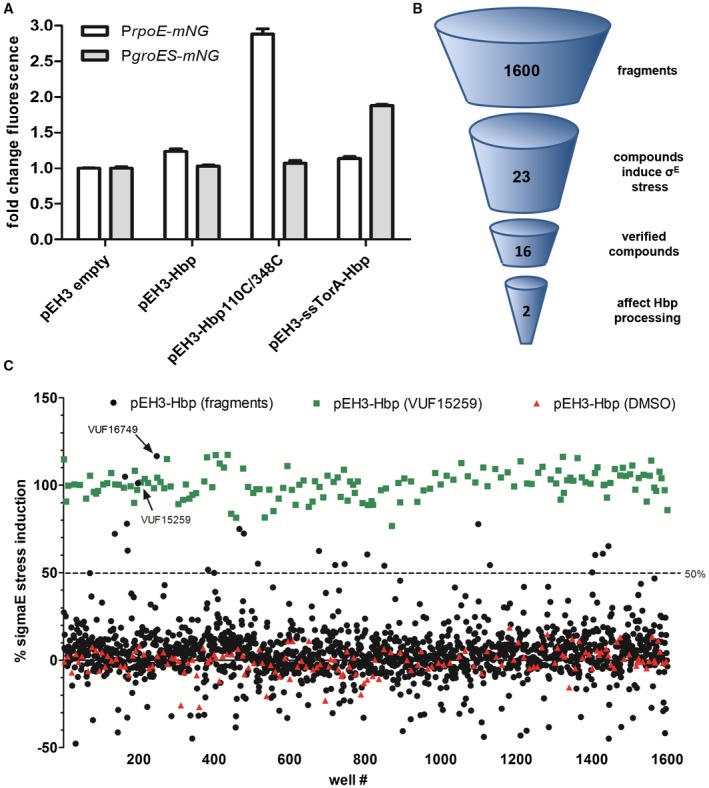
Figure 2.

Development of stress‐based assay and summary of fragment screen. A. Cell envelope stress and cytosolic stress were determined using PrpoE‐mNG and PgroES‐mNG reporter constructs respectively. Hbp species were co‐expressed from the pEH3 plasmid in E. coli TOP10F’ bacteria grown in a 96‐well plate. Hbp expression was induced with IPTG and after 3 h of incubation mNG fluorescence and OD660 were measured. Fluorescence intensities were corrected for growth and the fold increase in fluorescence was calculated compared to the empty vector control (pEH3). Error bars represent the standard deviation of triplicate samples. B. In total, 1600 fragments were screened for σE stress induction. 23 compounds induced σE stress in the primary screen whereas secondary screening verified 16 compounds as hits. An orthogonal assay showed that two compounds, VUF15259 and VUF16749, impaired secretion of Hbp. C. Plot of σE stress induction of each compound compared to cells expressing Hbp incubated in 200 µM VUF15259 (positive control, green) and cells expressing Hbp incubated in 1% DMSO (negative control, red). The positive control was set to 100%. Compounds were selected as hits with a stress induction of ≥ 50%, indicated by a dashed line. Compound VUF15259 and VUF16749 is indicated with an arrow. [Colour figure can be viewed at https://wileyonlinelibrary.com]
