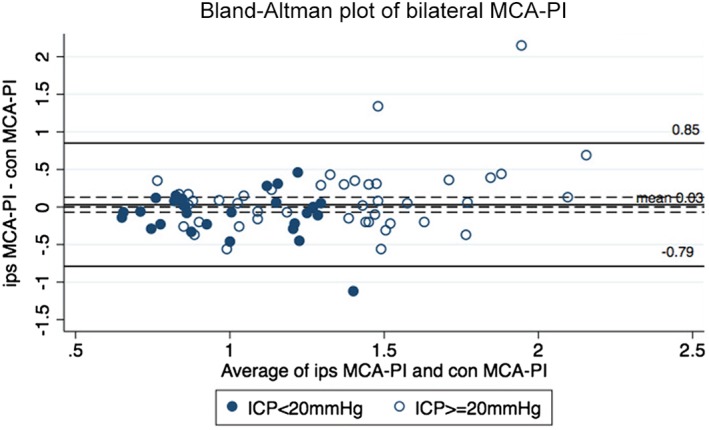
Figure 2.

Bland‐Altman plot for bilateral MCA PIs. The plot displays the disagreement of the ipsilateral (ips) and contralateral (con) MCA PIs. The solid black line indicates the mean of the difference between ipsilateral and contralateral PIs (0.03), and the dashed black lines indicate upper and lower limits of agreement (–0.79, 0.85). In total, 4.2% (3 of 71) of the points were out of the limits of agreement.
