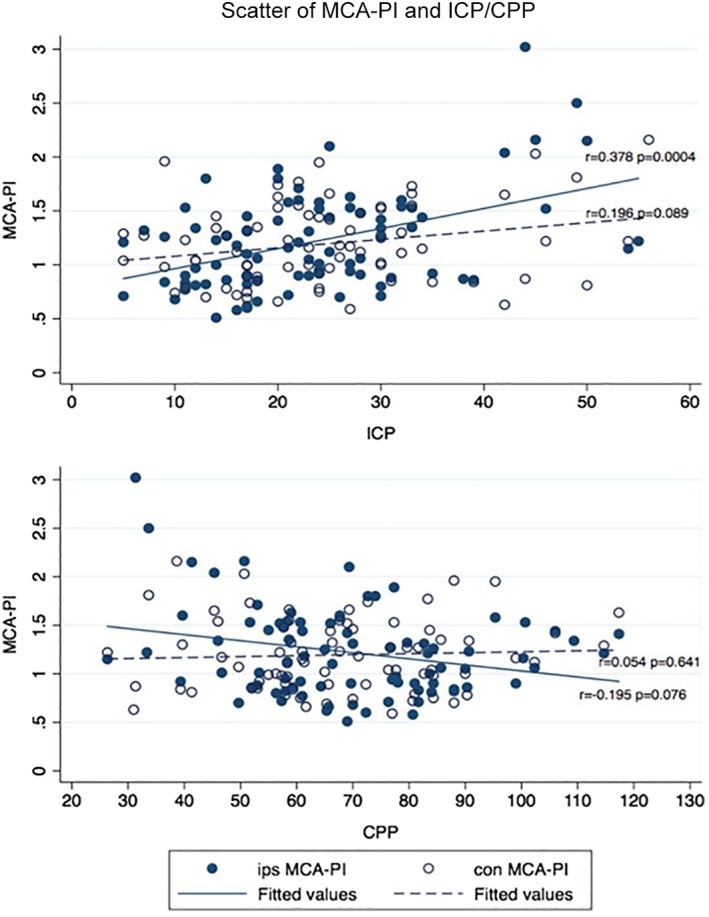
Figure 3.

Scatter diagrams of bilateral MCA PIs with ICP and CPP. The diagrams display the ipsilateral (ips) and contralateral (con) MCA PIs. The Spearman correlation coefficient was significant at the .05 level.

Scatter diagrams of bilateral MCA PIs with ICP and CPP. The diagrams display the ipsilateral (ips) and contralateral (con) MCA PIs. The Spearman correlation coefficient was significant at the .05 level.