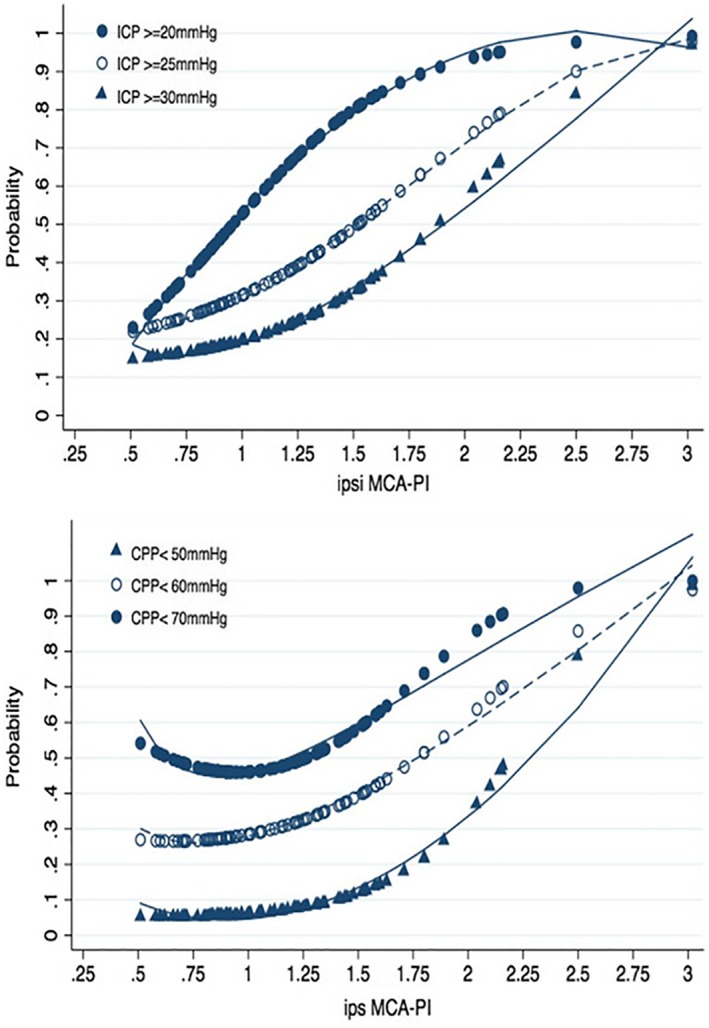
Figure 4.

Probability charts of the ipsilateral (ipsi and ips) MCA PI for ICP and CPP. Probability charts were created for the ipsilateral MCA PI to assess the possibility to be above a particular ICP value (20/25/30 mm Hg) and below a particular CPP value (70/60/50 mm Hg).
