
Figure 2.
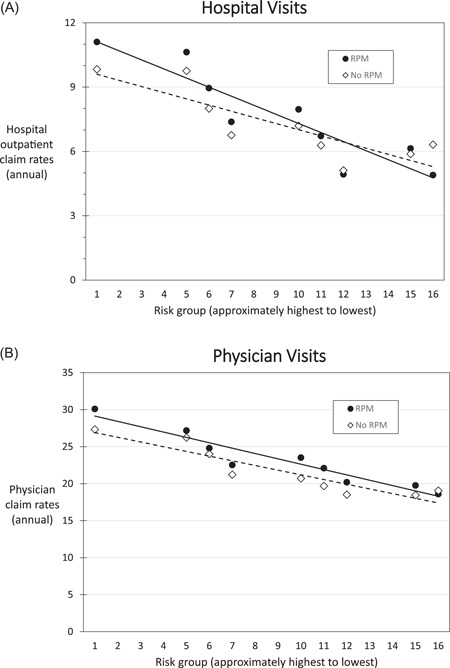
Annual outpatient claim rates by risk group. Rates for groups of fewer than 100 patients have been omitted. Lines have been added to show trends. Risk groups created by combinations of categorical rehospitalization and mortality risks are listed sequentially from highest to lowest. A linear trendline was added to illustrate observed trends in the data. For both hospital outpatient and physician claim rates, a similar trend is observed with higher rates for RPM vs no RPM, RPM, remote patient monitoring