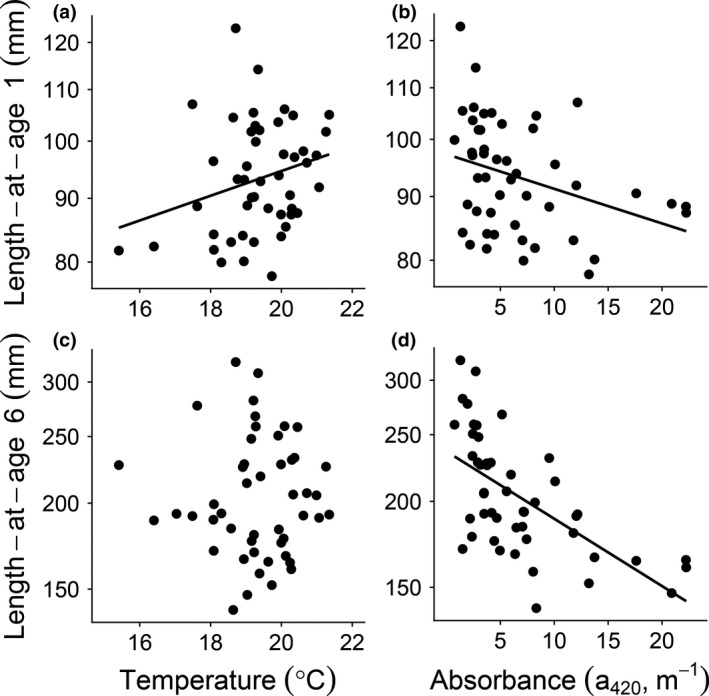
Figure 5.

Length‐at‐age 1 and 6. The relationships between length‐at‐age 1 (in mm, top graphs) and (a) temperature and (b) absorbance and between length‐at‐age 6 (in mm, bottom graphs) and (c) temperature and (d) absorbance. Black dots represent individual lakes and solid black regression lines significant linear relationships. See Table 1 for statistical analyses
