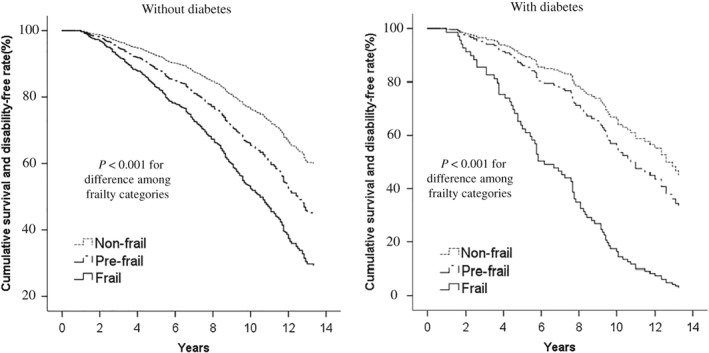
Figure 1.

Cumulative survival and disability‐free curves, according to frailty category, in persons without and with diabetes (Kusatsu Study, 2002–2011, followed until 2015). A Cox proportional hazards model was used to adjust cumulative rates for age and sex according to frailty category.P‐values were calculated by using a Cox proportional hazards regression model in which ordinal numbers were assigned to each frailty category (non‐frail = 1, prefrail = 2, frail = 3).
