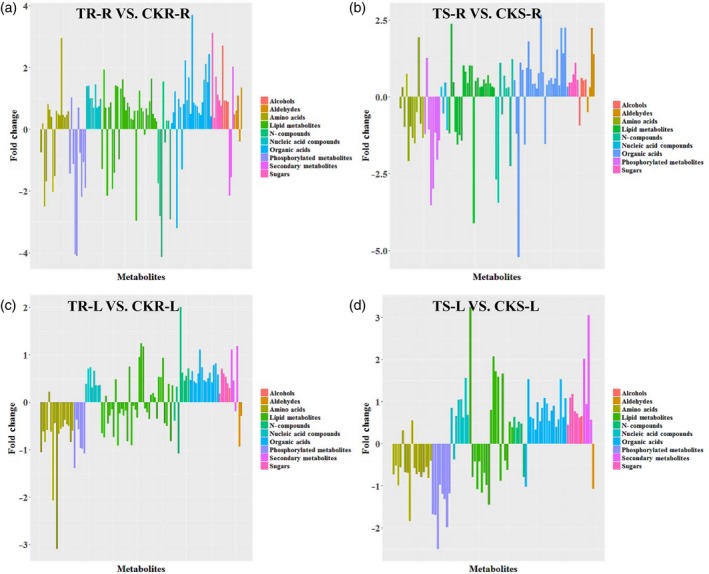
Figure 2.

Overview of metabolites with significantly different concentrations between Pi‐deficient and Pi‐sufficient conditions. Histograms indicate metabolites with concentrations differing significantly between Pi‐deficient and Pi‐sufficient conditions. The x coordinates identify the metabolites and the y coordinates indicate the magnitude of the difference expressed as log2 (Pi‐deficient conditions/Pi‐sufficient conditions). Red bars indicate increases in metabolite concentration (logarithm > 0) and cyan bars indicate concentration decreases (logarithm < 0). (a) Metabolite concentration differences in Pi‐resistant roots between Pi‐deficient and Pi‐sufficient conditions (TR‐R versus CKR‐R). (b) Metabolite concentration differences in Pi‐sensitive roots between Pi‐deficient and Pi‐sufficient conditions (TS‐R versus CKS‐R). (c) Metabolite concentration differences in Pi‐resistant leaves between Pi‐deficient and Pi‐sufficient conditions (TR‐L versus CKR‐L). (d) Metabolite concentration differences in Pi‐sensitive leaves between Pi‐deficient and Pi‐sufficient conditions (TS‐L versus CKS‐L).
