
Figure 7.
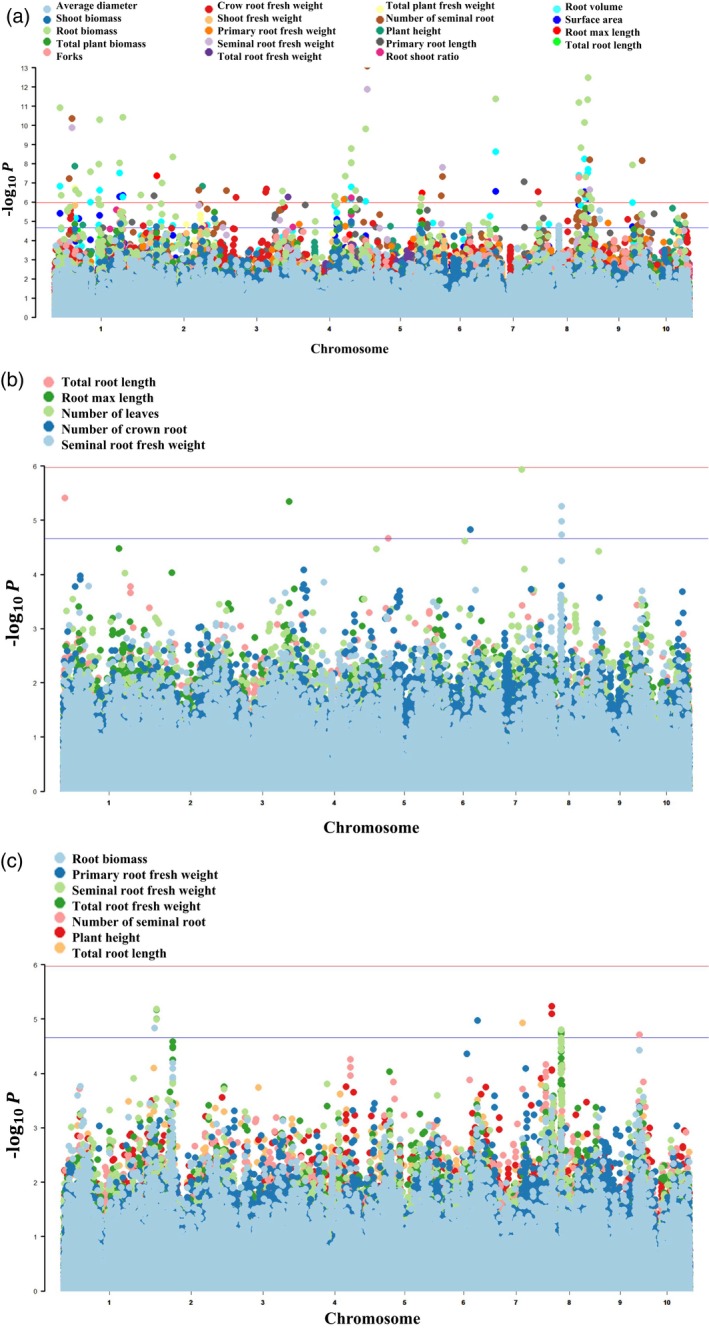
Manhattan plot of genome‐wide association analysis results with significant genetic association [−log(P) > 4.66). A mixed linear model (MLM) was used to fit both Q and K matrixes: (a) 178 single‐nucleotide polymorphism (SNP) markers were significantly associated with low‐Pi‐tolerance indices (LPTI = TPD/TPS) of 19 morphological traits; (b) eight SNP markers were significantly associated with five morphological traits under Pi‐deficient conditions; (c) 15 SNP markers were significantly associated with seven morphological traits under Pi‐sufficient conditions.