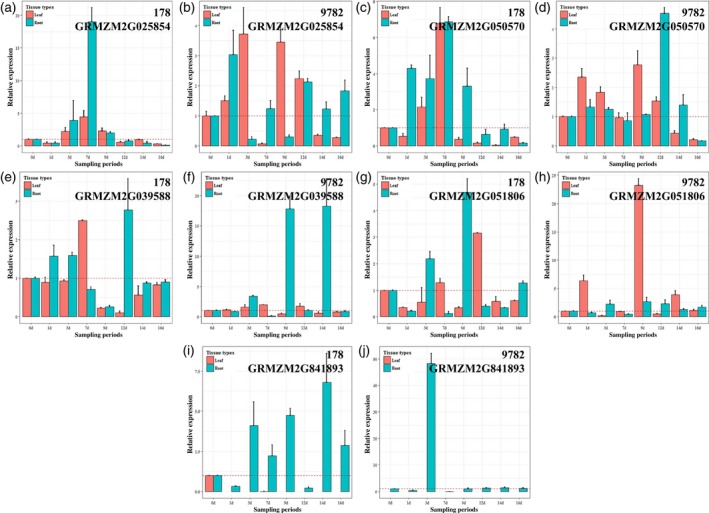
Figure 8.

Analysis of the five consensus candidate genes by reverse‐transcription quantitative polymerase chain reaction (RT‐qPCR) in lines 178 and 9782. The relative expression level represents the ratio of low‐Pi/sufficient‐Pi. (a–j) Dynamic expression patterns of the five consensus genes in leaf and root tissues after different treatment periods.
