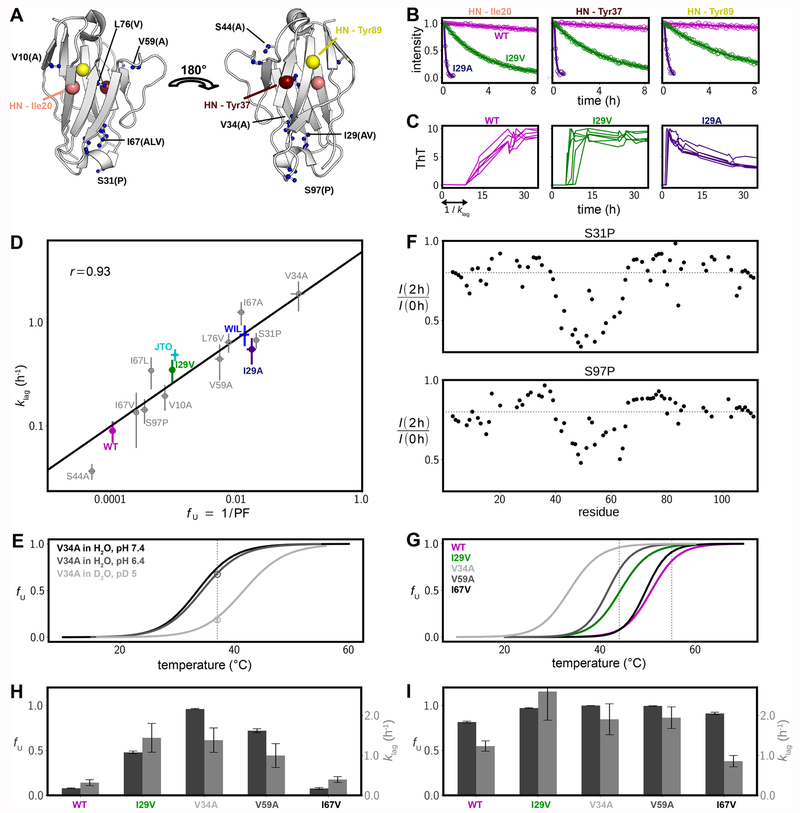
Figure 2.
Thermodynamic stability and aggregation propensities for a series of 6aJL2-VL mutants. (A) Positions of the mutated residues plotted as blue spheres on the 3D structure of the domain (PDB 2w0k57) using a ball and stick representation. New amino acids introduced by mutation are indicated by the single-letter code in brackets. The three large spheres delineate the amide groups whose solvent hydrogen exchange decay is shown in panel B. (B) Hydrogen/deuterium exchange time profiles for three amide groups of selected 6aJL2-VL variants. (C) Kinetics of aggregation as monitored by ThT fluorescence for three selected 6aJL2-VL variants; six traces are shown in each subpanel. The decrease in fluorescence for the I29A variant at long times is likely because fibrils become larger and less accessible to ThT or due to self-quenching. (D) Correlation between the estimated fraction of fully unfolded protein fU and the inverse duration of the lag phase, klag, shown on a log–log scale. Values of fU were calculated as the reciprocal of the average protection factor for the most protected residues (maroon-colored residues in Figure S1), with uncertainties obtained from the standard deviation of these values. Errors in klag rates are based on at least six repetitions of the ThT aggregation assays. (E) Thermal melting curves for V34A for several conditions, as measured by intrinsic fluorescence (lines) and solution NMR (circles). The NMR-based fU value in D2O at pH 5, 37 °C was obtained from hydrogen exchange measurements, while the fU value at pH 6.4 and in H2O (NMR, 37 °C) was calculated from the volumes of the native- and unfolded-state peaks for G112 in 1H,15N HSQC spectra. The dashed vertical line at 37 °C indicates the temperature at which the NMR experiments were performed. (F) Decrease in amide peak intensities after 2 h of hydrogen exchange of.S31P and S97P 6aJL2-VL fibrils (23 °C); the gray dashed lines indicate a value of 0.8. Similar profiles are obtained for the WT domain (Figure 1H). (G) Thermal melting curves for five 6aJL2-VL variants in H2O at pH 7.4. Dashed vertical lines are positioned at 44 and 55 °C (see panels H and I). (H) Bar plots of fU values (dark gray, left y-axis) and klag (pale gray, right y-axis) at 44 °C. (I) As in panel H, but at 55 °C.

