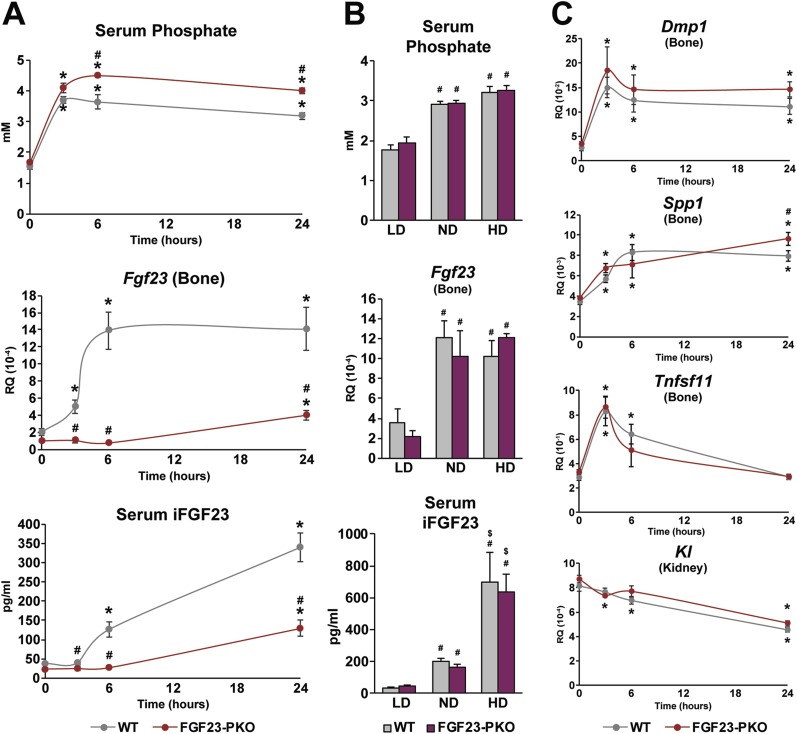
Figure 4.
Primary and secondary responses of Fgf23 expression in response to dietary P intake. (A and C) FGF23-PKO and wild-type (WT) littermates were fed P-deficient diets at 5 wk of age for 1 wk and then a high-P diet for 0, 3, 6, or 24 h. Serum P and iFGF23 levels and expression levels of the indicated genes in the tissues described are presented. Gene expression level represents relative quantitation (RQ) normalized to Gapdh (ΔΔCT). Each value is the average of four to six mice per group, and error bars represent SEM. *P < 0.05 compared with 0-hour groups; #P < 0.05 compared with WT littermates fed the high-P diet for the same period. (B) FGF23-PKO and WT littermates at 4 wk of age were fed diets containing 0.1% P [low-phosphate diet (LD)], 0.6% P [normal diet (ND)], or 1.65% P [high-phosphate diet (HD)] until 6 wk of age. Serum P and iFGF23 levels and Fgf23 expression level in bone are presented. Gene expression level represents RQ normalized to Gapdh (ΔΔCT). Each value is the average of six to eight mice per group, and error bars represent SEM. #P < 0.05 compared with the same genotype mice fed an LD; $P < 0.05 compared with the same genotype mice fed an ND. No statistical difference was found between FGF23-PKO and WT littermates.

