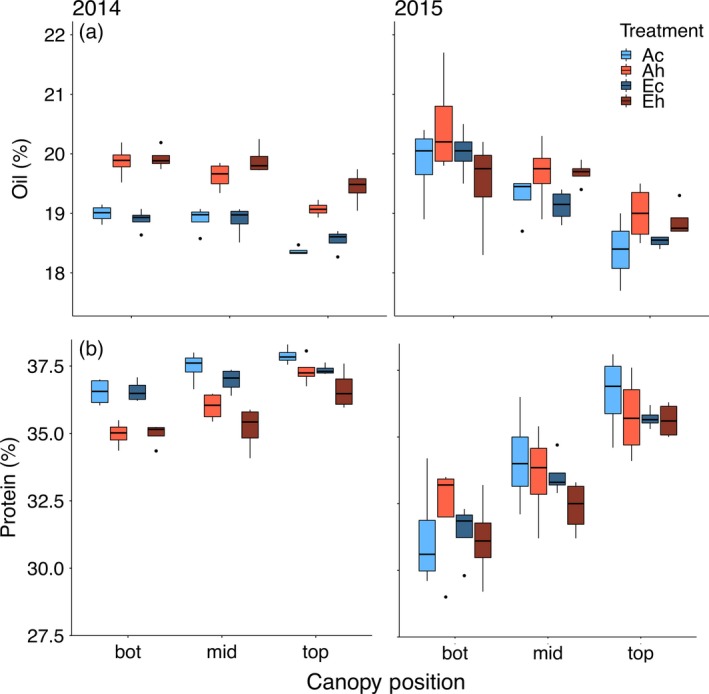
Figure 4.

Concentration of (a) oil and (b) protein in seeds produced at the bottom, middle and top canopy positions as impacted by elevated atmospheric CO2 concentration (eCO 2) and elevated temperature treatments in 2014 and 2015.
Treatment abbreviations and boxplots as in Figure 1.
