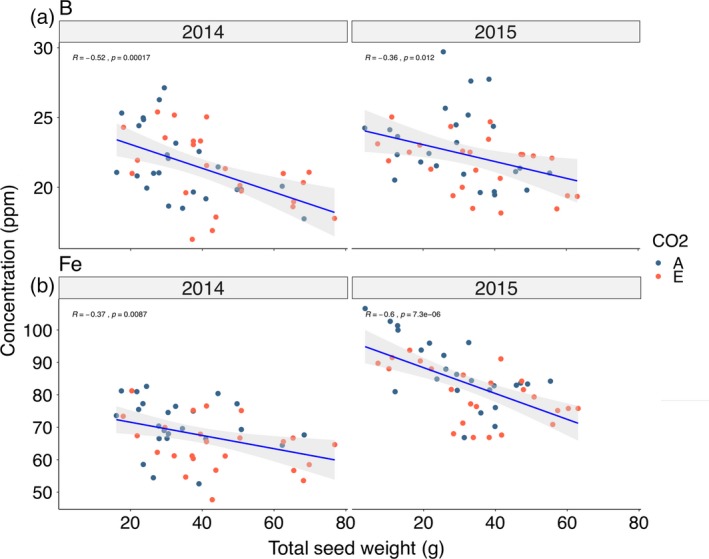
Figure 9.

Correlation plots between seed mineral concentration and seed yield (g per 10 plants) at the corresponding canopy position for (a) seed [B] and (b) seed [Fe].
Data points are coded for samples taken from plants grown at ambient and elevated atmospheric CO2 concentration (eCO 2).
