Figure 1.

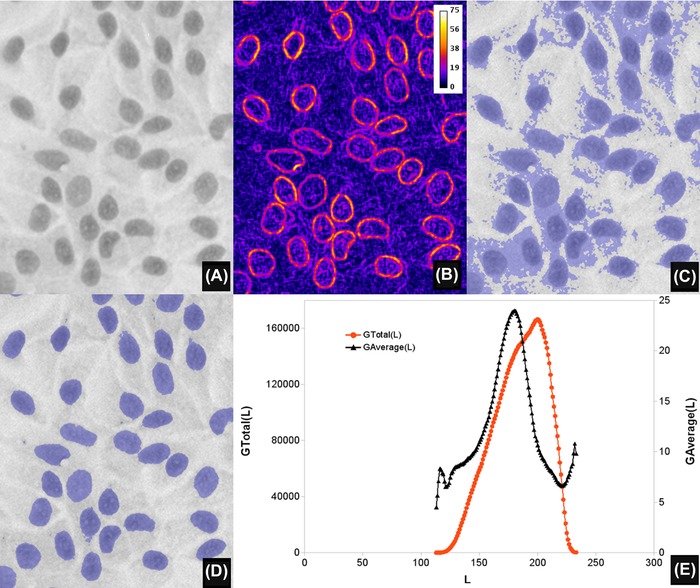
Automated global thresholding. (A) A greyscale haematoxylin stained image of a monolayer of H400 keratinocytes cell line, grown on glass (magnification ×20, field width 168 μm), preprocessed with a Gaussian filter of radius 1. (B) Image gradient of (A), computed with the Beucher morphological gradient and displayed as pseudo‐colour, for clarity purposes. (C) Thresholded (overlay in blue) image obtained using the value L at which G Total (L) is a maximum (L = 200). (D) Result of using the value L at which G Average (L) shows a maximum (L = 180). Note how, in this particular image, (D) corresponds faithfully to the extent of the nuclei depicted in (A). (E) Plots of G Total (L) and G Average (L) as a function of threshold L for (A).
