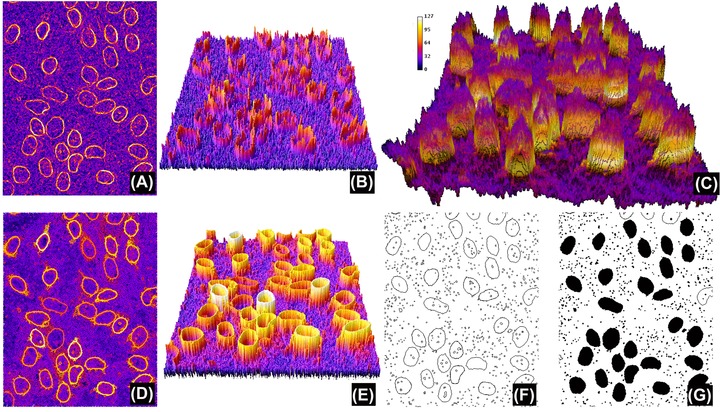
Figure 3.

Region‐based segmentation. (A) Gradient of image in Figure 1(A), this time computed using the Sobel filter (note the similarities to Fig. 1B). (B), (E) Pseudo‐3D representation of (A) and (D), respectively. (C) Stack S, where the z coordinate represents L (i.e. the test threshold, the z axis inverted for clarity purposes, with high L at the bottom). The labelling colour is G Average (L, c). (D) Maximum projection of stack S. Note that, while similar to (A), the intensity has been simplified and the boundaries of regions have all the same value for a given L (shown more clearly when comparing (E) with (B)). Computing regional maxima of (D) returns those regions of pixels that are surrounded by strictly lower pixel values (in black, F) and the region filling is shown in (G). Note that this definition of regional maxima means that touching objects could potentially not be detected if they have been labelled with different values (so both cannot be surrounded by strictly lower value pixels). Indeed, three objects in (D) have not been segmented in (F); however, this can be successfully resolved using object specification constraints as shown in Figure 4.
